
Setting up a WordPress site on a fresh VPS is easy — any developer can spin up a droplet and install a theme. But running a real WordPress site is a different challenge. I’m talking about a professional-grade setup with 27 plugins, full-page caching, Redis for object caching, and a dual web server configuration using both Apache and NGINX. This isn’t a clean demo install — it’s a realistic, heavy site that mirrors what many agencies, developers, and growing businesses deploy in production.
In this article, I take that kind of real-world WordPress stack and benchmark it across four different DigitalOcean droplets — each with different CPU architectures, RAM sizes, and regions. It’s the follow-up to my earlier Digital Ocean Droplet Performance Benchmark, where I tested raw CPU, RAM, disk, and network performance. But this time, the focus is squarely on application-level performance: how fast WordPress responds, how well caching behaves, and how stack choices like Redis and PHP 8.2 affect performance under real traffic conditions.
Missed the First One? Want to See What’s Next?
- Part 1: Digital Ocean Droplet Performance Benchmark
- Compared CPU, memory, disk, and network performance across Intel and AMD droplets in different regions.
- Part 3: WordPress Performance with Apache, NGINX, Redis & PHP-FPM
- Pushed the same WordPress stack further using PHP-FPM with a new extreme-load test for concurrency handling.
Let’s first revisit the droplet configurations:
| Hostname | Region | CPU Type | RAM | Disk | OS |
srv1 | NYC3 | AMD | 1 GB | 25 GB SSD | AlmaLinux 9 |
srv2 | SGP1 | AMD | 1 GB | 25 GB SSD | AlmaLinux 9 |
srv100 | NYC1 | AMD | 2 GB | 50 GB SSD | AlmaLinux 9 |
srv1000 | NYC3 | Intel | 1 GB | 25 GB SSD | AlmaLinux 9 |
Test Setup:
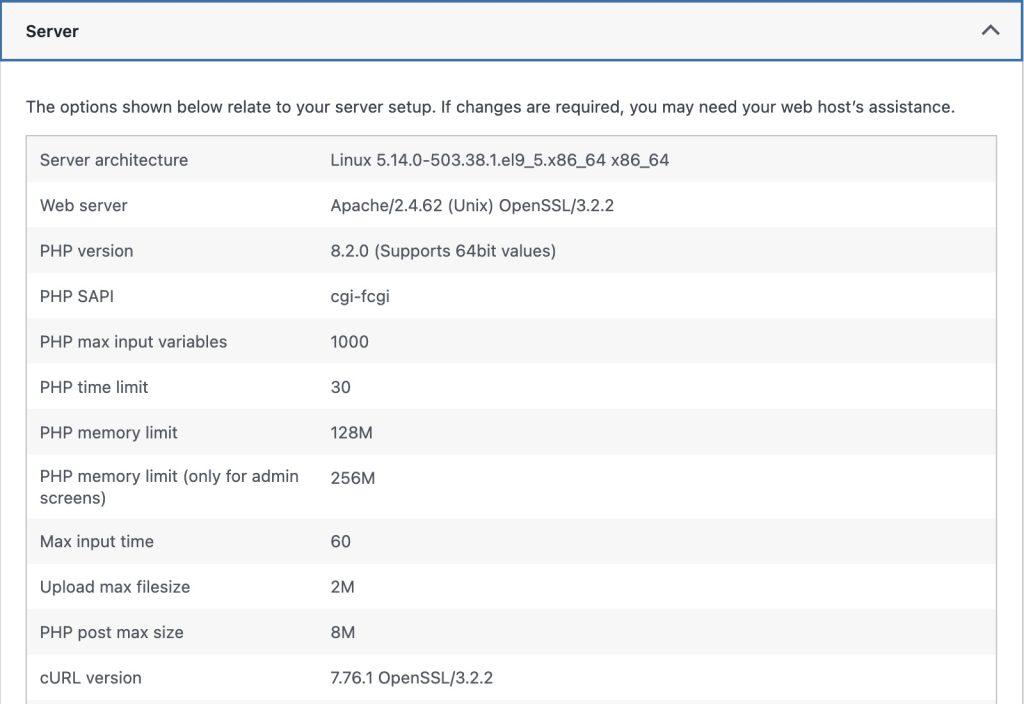
Each droplet was configured with a full WordPress stack designed to mirror a real production site — not a minimal install, but a fully featured setup. Here’s what was running on each server:
- Apache 2.4.62 with NGINX as a reverse proxy
- PHP 8.2.0 with Opcache enabled for faster execution
- MariaDB 10.5.27 as the database engine
- Redis configured for object caching
- A full WordPress site featuring:
- 40 pages
- 27 plugins (25 active during testing)
- A fully loaded theme with custom blocks and custom post types
Benchmark Results
To understand how each droplet handles real-world WordPress load, I ran three rounds of controlled performance tests. Each test simulated traffic to a production-grade site with 27 plugins, Redis caching, and no full-page cache. Results highlight not just peak performance, but also stability, consistency, and how well each server handles stress over time.
Test 1: Initial WordPress Performance
This test simulated real-world traffic on WordPress site running PHP-CGI. I began with moderate concurrency — just 10 users and 80 requests — after discovering that pushing these droplets harder would quickly crash services or make the VPS completely unresponsive. In fact, I had to repeat test multiple times (up to 5) to find the sweet spot that wouldn’t overwhelm the system while still revealing performance characteristics.
| Hostname | Region | CPU | RAM | Req/sec | Median Resp Time (ms) | Total Time (s) | Max Resp Time (ms) |
srv1 | NYC3 | AMD | 1 GB | 0.36 | 28,093 | 223.2 | 39,413 |
srv2 | SGP1 | AMD | 1 GB | 0.26 | 35,644 | 312.9 | 60,429 |
srv100 | NYC1 | AMD | 2 GB | 0.66 | 14,825 | 121.5 | 18,115 |
srv1000 | NYC3 | Intel | 1 GB | 0.29 | 32,983 | 273.1 | 44,667 |
srv100(2GB RAM, AMD) was clearly the fastest — it handled the requests more than twice as quickly as the next-best droplet.srv1(1GB, AMD) did OK, but it started to slow down under even light load. Its median response time was nearly 2x slower thansrv100, likely due to limited memory and the inefficiency of PHP-CGI.srv1000(1GB, Intel) was slower than the AMD-based droplets in every metric. Intel’s legacy droplet performance just doesn’t hold up.srv2(1GB, AMD, Singapore region) had the worst performance, with extremely long response times and the longest test duration. The likely causes are:- Higher SSL handshake or connect time (700ms+)
- Slower network to the test machine
Test 2: Stability Check Under Repeat Load
This round re-ran the same test on the same stack to check for consistency and stability under stress. Once again, concurrency was kept at 10 and requests at 80, as anything more would destabilize the server — in some cases forcing a reboot.
| Hostname | Region | CPU | RAM | Req/sec | Median Resp Time (ms) | Total Time (s) | Max Resp Time (ms) |
srv1 | NYC3 | AMD | 1 GB | 0.35 | 27,810 | 229.90 | 44,039 |
srv2 | SGP1 | AMD | 1 GB | 0.25 | 39,410 | 326.24 | 49,217 |
srv100 | NYC1 | AMD | 2 GB | 0.70 | 14,230 | 114.93 | 15,266 |
srv1000 | NYC3 | Intel | 1 GB | 0.31 | 31,026 | 256.69 | 42,377 |
srv100remained the fastest and most stable, with even lower total time — showing consistent efficiency under pressure.srv1showed stable behavior but a slight creep in response times, likely from cumulative load or thermal throttling.srv1000improved very slightly in max latency, but AMD droplets still easily outpaced it.srv2continued to underperform. Network latency and CPU limitations in this region seem to be persistent bottlenecks.
Test 3: Sustained Stress and Concurrency Limits
In this third round, I continued using the same 10-concurrency, 80-request model to simulate consistent pressure. Anything more still caused service timeouts or PHP crashes, so I stayed within known-safe limits. This final run aimed to confirm patterns and uncover any performance degradation over time.
| Hostname | Region | CPU | RAM | Req/sec | Median Resp Time (ms) | Total Time (s) | Max Resp Time (ms) |
srv1 | NYC3 | AMD | 1 GB | 0.29 | 36,271 | 272.38 | 51,648 |
srv2 | SGP1 | AMD | 1 GB | 0.25 | 38,925 | 320.07 | 61,171 |
srv100 | NYC1 | AMD | 2 GB | 0.69 | 14,429 | 115.59 | 16,673 |
srv1000 | NYC3 | Intel | 1 GB | 0.29 | 33,587 | 272.73 | 43,609 |
srv100remained the only droplet that comfortably handled repeated load, showing excellent consistency over all three tests.srv1performance degraded slightly in this round, indicating it may be close to its resource limit even with moderate traffic.srv1000was slightly more stable than expected but still underwhelming.srv2now clocked the worst response times yet — hitting a 61-second max latency.
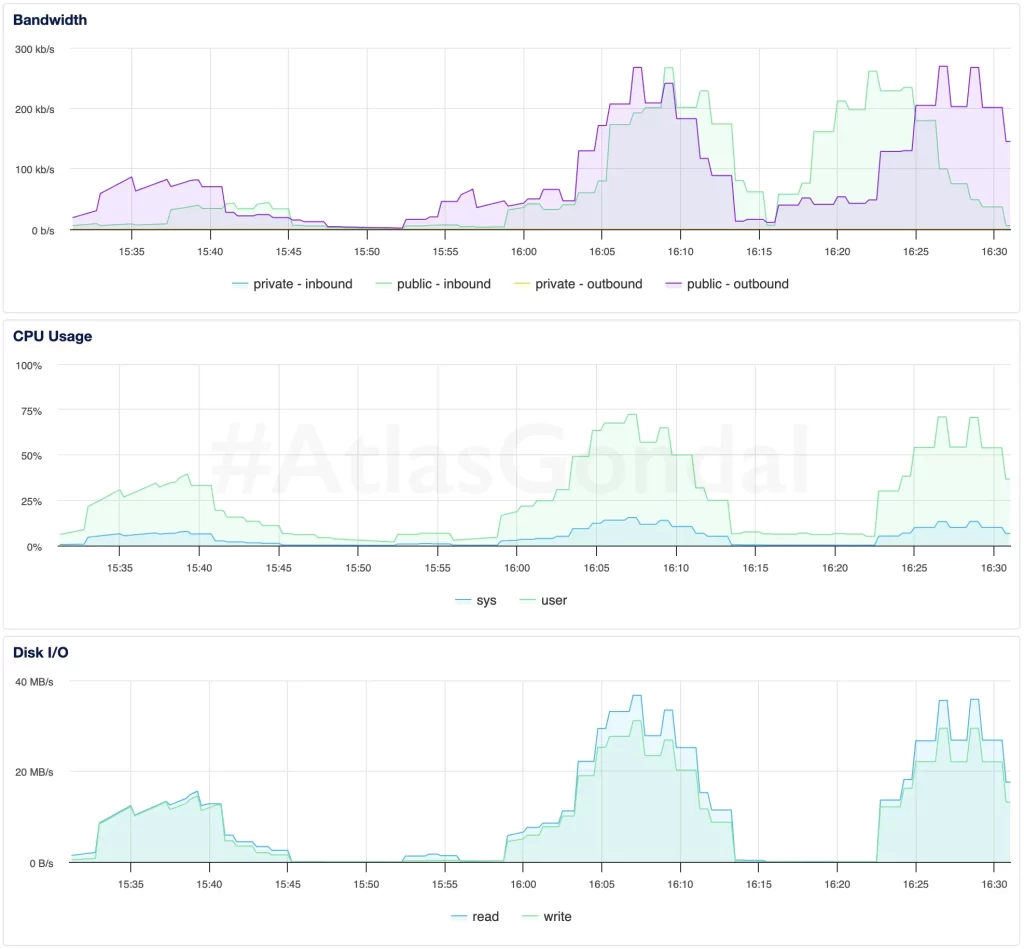
Monitoring Graphs Summary
To complement the raw performance data, I captured resource usage metrics during each test run. These graphs provide a behind-the-scenes look at how each server handled CPU load, memory usage, and disk I/O under stress. In some cases, they helped explain slowdowns that weren’t obvious from response times alone — like CPU saturation, inefficient caching, or regional latency. Together, they offer a complete picture of how infrastructure and application behavior intersect.
1. srv1: (1 GB AMD, NYC3)
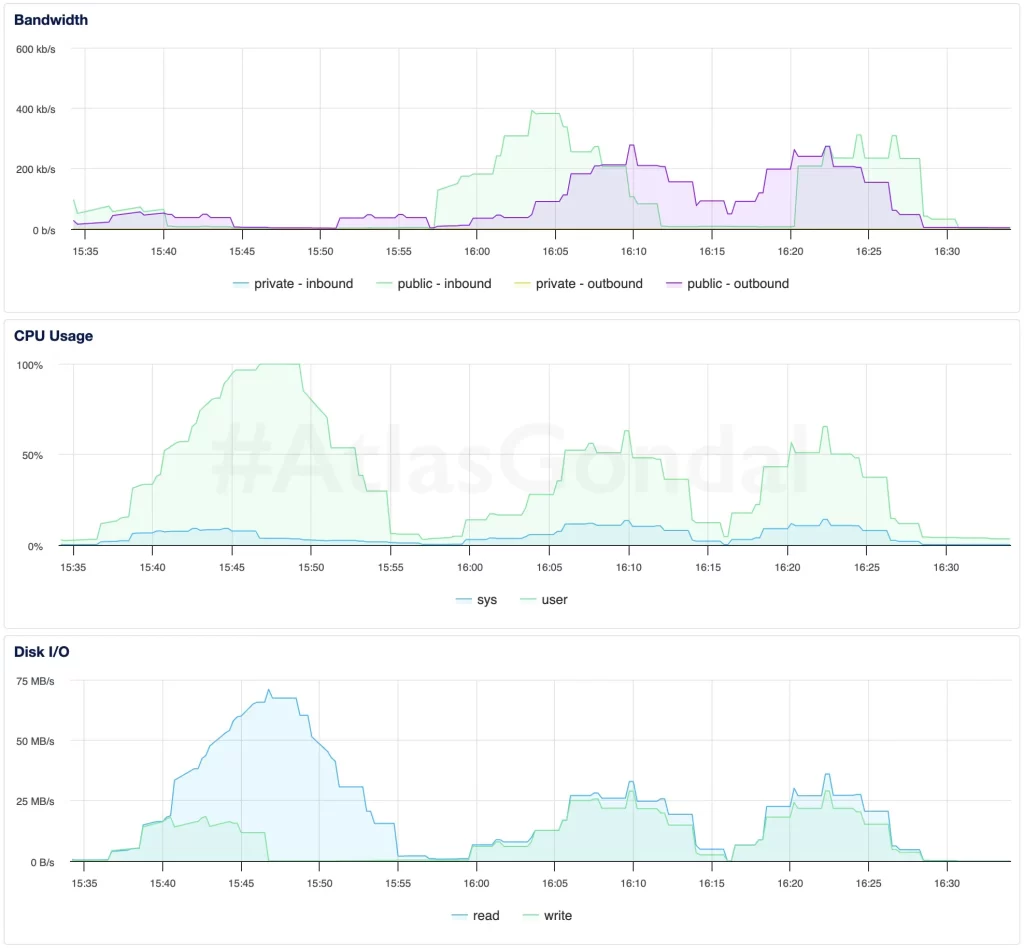
- CPU usage hits 100% during peak periods — a clear sign that PHP-CGI can’t scale on small instances.
- Disk I/O remained moderate; bottleneck is likely PHP or memory, not storage.
2. srv2: (1 GB AMD, SGP1)
- Network latency and inconsistent CPU usage suggest external or regional factors are impacting performance.
- Disk activity is low, indicating delays are not from storage but processing/network.
3. srv100: (2 GB AMD, NYC1)
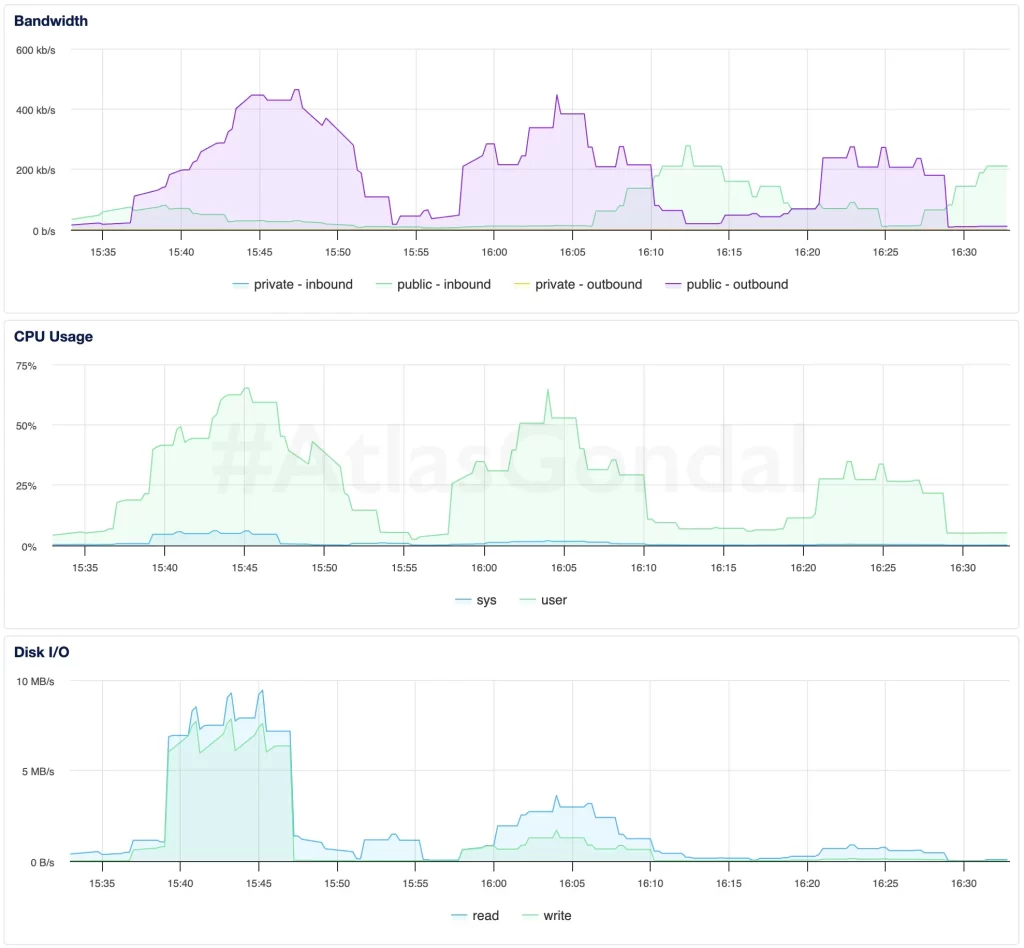
- CPU remained under 70%, disk I/O was consistent, and request handling was predictable.
- Excellent resource balance — ideal candidate for production workloads.
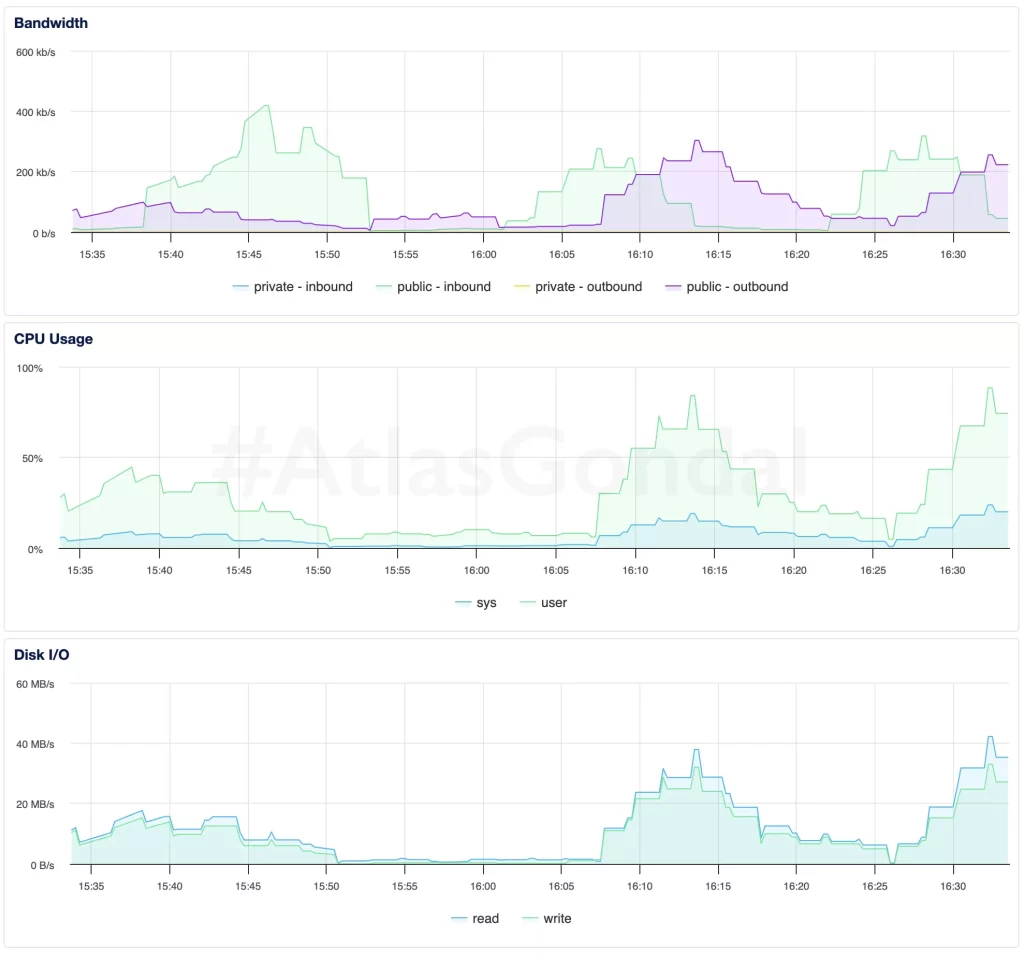
4. srv1000: (1 GB Intel, NYC3)
- Higher disk usage might indicate inefficient caching or database behavior.
- Intel-based droplets don’t scale well for WordPress workloads under concurrency.
Additional Application-Level Metrics
To go beyond server-side concurrency and latency, I also captured WordPress-level performance using Query Monitor and real-world frontend timing using Pingdom Tools with San Francisco (USA) Server. These metrics reveal how PHP execution, memory usage, and network latency impact actual page load experience.
srv100(2GB, AMD) had the fastest total load time (2.92s) and one of the lowest wait times (1832 ms). It’s the most balanced performer both server-side and client-side.srv1andsrv2were close in terms of backend performance (around 3.5–3.8s), butsrv2had the highest frontend wait time (2631 ms) — likely due to geographical distance or slower initial connection.srv1000(1GB, Intel) was the worst in both backend and frontend metrics — with the highest execution time (4.83s) and elevated wait time (2256 ms). This aligns with earlier benchmarks showing CPU and memory inefficiencies.- All droplets used similar memory (~32MB) and executed ~52–57 queries, indicating that performance differences stem mostly from infrastructure and latency, not app configuration.
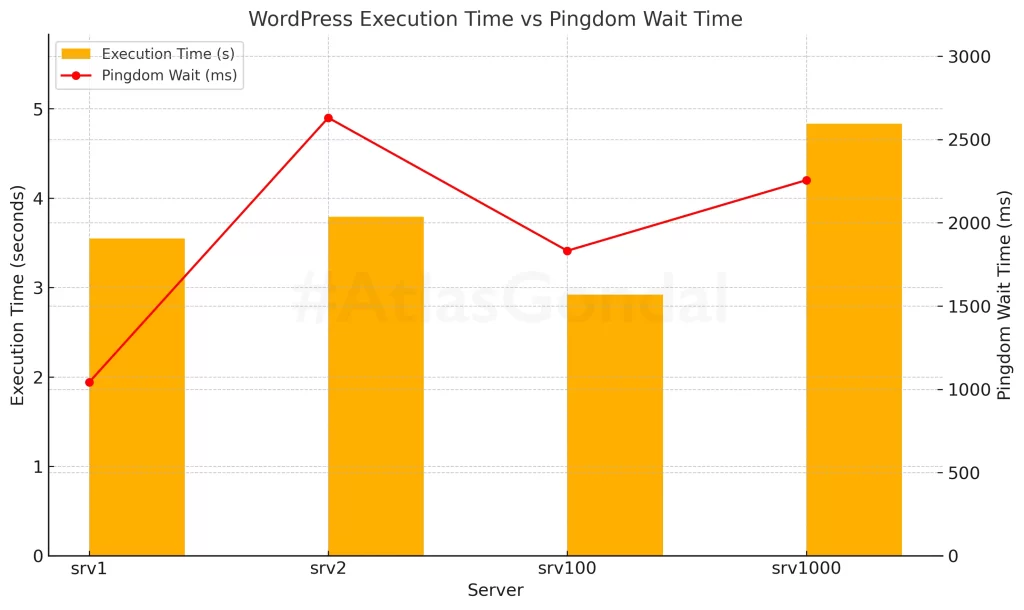
srv100had both the lowest execution time (2.92s) and a solid wait time (1832ms) — making it the most responsive overall.srv2suffered from the highest frontend wait (2631ms), highlighting regional latency.srv1000had the slowest backend execution (4.83s), further proving that Intel-based droplets lag in WordPress-heavy environments.
Conclusion
After three rounds of real-world WordPress benchmarking, deep stack monitoring, and client-side testing, the verdict is clear: infrastructure choices matter more than the spec sheet suggests.
srv100 (2GB AMD, NYC1) was consistently the top performer in every test. It not only handled concurrency better but maintained stable performance across all metrics — backend, frontend, and system-level resource usage. It’s the kind of VPS I’d confidently run production workloads on.
On the other hand, srv1 and srv1000, both 1GB droplets (AMD and Intel respectively), showed that 1GB RAM is a tight squeeze for plugin-heavy WordPress stacks — especially when running under PHP-CGI. Performance dipped under repeated load, and the system often hovered near failure. Enabling PHP-FPM and caching in a future test will likely bring major improvements.
srv2 (AMD, Singapore) consistently had the worst performance despite similar specs. Regional latency and SSL handshake delays played a role, showing that geography and network routing can be just as important as RAM or CPU when it comes to global performance.
These tests reinforced that benchmarking isn’t optional. No matter how similar your droplets appear on paper, real workloads reveal real differences.
Need Help?
If you’re building more than a blog — whether it’s a custom API, e-commerce site, or enterprise SaaS platform — and you care about speed, reliability, and scalability, I can help.
I offer services in:
- Performance tuning for WordPress, Laravel, Node.js, and Django
- Infrastructure setup and automation for LEMP/LAMP stacks
- Penetration testing and server hardening for security-critical applications
- Mobile and web development (React, Flutter, Vue, Next.js)
- Ongoing sysadmin and DevOps support for scaling or recovering servers
Get in touch to build something that runs fast and doesn’t fall over. Also, if you want to try Digital Ocean with $200 in free credit? Sign up using my referral link here.
No comment yet, add your voice below!