How PHP-FPM Boosts WordPress Performance on Digital Ocean VPS

php-fpm-wordpress-performance-digital-ocean

Setting up WordPress is easy task. Tuning it to run fast under real-world pressure? That’s where things get serious. In my previous article, I tested a heavy, production-grade WordPress stack on four Digital Ocean droplets — using Apache, NGINX, Redis, and PHP 8.2, with the app running under PHP-CGI. The results were eye-opening: even modest traffic loads exposed performance bottlenecks in lower-memory VPS setups.

Now, I’ve taken that exact same stack — same WordPress site, same plugins, same VPS hardware — and rebuilt it to run on PHP-FPM instead of PHP-CGI. This article picks up right where the last left off, benchmarking WordPress performance with a much more efficient process manager behind the scenes. I wanted to find out just how much of a difference PHP-FPM makes, especially on constrained 1GB and 2GB droplets across different CPU types and regions.

Missed the Earlier Tests? Catch Up Here:

Let’s start by revisiting the droplet configurations I’ve been using throughout this series:

HostnameRegionCPU TypeRAMDiskOS
srv1NYC3AMD1 GB25 GB SSDAlmaLinux 9
srv2SGP1AMD1 GB25 GB SSDAlmaLinux 9
srv100NYC1AMD2 GB50 GB SSDAlmaLinux 9
srv1000NYC3Intel1 GB25 GB SSDAlmaLinux 9

Test Setup:

For this round of testing, I am using the same production-grade WordPress stack across four Digital Ocean droplets — but this time powered by PHP-FPM instead of PHP-CGI. The goal was to evaluate how this modern, efficient PHP handler affects performance under identical conditions.

Each droplet was configured to replicate a real-world WordPress environment, here’s the full stack:

  • NGINX as reverse proxy paired with Apache 2.4.62
  • PHP 8.2.0 running via PHP-FPM, with Opcache enabled for execution speed
  • MariaDB 10.5.27 handling the database layer
  • Redis configured for persistent object caching
  • A full-featured WordPress site includes:
    • 40 pages of content
    • 27 plugins (25 active during testing)
    • A fully loaded theme with custom blocks and custom post types

Benchmark Results

To understand how each droplet handles real-world WordPress load, I ran three rounds of controlled performance tests. Each test simulated traffic to a production-grade site with 27 plugins, Redis caching, and no full-page cache. Results highlight not just peak performance, but also stability, consistency, and how well each server handles stress over time.

Test 1: Initial WordPress Performance with PHP-FPM

This was the first run using the newly optimized stack with PHP-FPM enabled instead of PHP-CGI. I kept the same conditions — 10 concurrent users and 80 total requests — to ensure a fair comparison. What changed was how the servers responded: unlike before, there were no stalls or bottlenecks, and even 1GB droplets handled the traffic without reaching their breaking point. It immediately became clear that PHP-FPM brings serious efficiency gains, even without altering anything else in the stack.

HostnameRegionCPURAMReq/secMedian Resp Time (ms)Total Time (s)Max Resp Time (ms)
srv1NYC3AMD1 GB1.93495441.48993
srv2SGP1AMD1 GB1.54619151.89851
srv100NYC1AMD2 GB1.7560047.19998
srv1000NYC3Intel1 GB1.74516845.99417
  • srv1 (1GB, AMD) handled nearly 2 requests/sec with a median response time of 4954ms, outperforming its previous PHP-CGI result by a wide margin. For a 1GB droplet, this is a strong showing and highlights the efficiency boost from PHP-FPM.
  • srv2 (1GB, AMD, Singapore) remained the slowest performer overall, with the longest median (6191ms) and max response time (9851ms). Despite having the same specs as srv1, regional latency and connection overhead continue to drag its numbers down.
  • srv100 (2GB, AMD) posted good results (1.70 RPS, 5600 ms median), but was slightly slower than srv1 in response time, which is unexpected. The higher memory may help under more load, but at this level, it seems less impactful.
  • srv1000 (1GB, Intel) was surprisingly efficient in this test. It tied srv100 in requests/sec and even slightly beat it in median latency, suggesting PHP-FPM helps mitigate some of Intel’s historical underperformance seen in earlier PHP-CGI tests.

Test 2: Stability Check Under Repeat Load (PHP-FPM)

This test was a repeat under identical conditions, used to measure consistency after the servers had time to “warm up” with PHP-FPM. Resource usage and performance patterns were more stable this time around. Median response times improved slightly in most cases, suggesting the stack was able to maintain performance under sustained but predictable load — something that caused significant slowdown or even failure under PHP-CGI.

HostnameRegionCPURAMReq/secMedian Resp Time (ms)Total Time (s)Max Resp Time (ms)
srv1NYC3AMD1 GB2.00487240.077562
srv2SGP1AMD1 GB1.56614251.259650
srv100NYC1AMD2 GB1.74553245.998937
srv1000NYC3Intel1 GB1.75520245.768269

  • srv1 (1GB, AMD) continued to lead with 2.00 requests/sec and a median response time of just 4872 ms — slightly faster than its Test 1 result. It also had the lowest total test time, confirming that FPM continues to benefit lower-memory droplets.
  • srv2 (1GB, AMD, SGP1) again trailed behind, with the highest latency (6142 ms median) and the slowest throughput (1.56 RPS). While slightly improved, network location and TLS handshake times remain limiting factors.
  • srv100 (2GB, AMD) held a respectable 1.74 RPS, but was outpaced by srv1 yet again in response times, which may suggest diminishing returns from RAM when the site isn’t heavily loaded.
  • srv1000 (1GB, Intel) surprisingly matched srv100 in performance, with a median of 5202 ms and a respectable 1.75 RPS. This consistency implies PHP-FPM is evening out some of the architectural disadvantages seen in the PHP-CGI runs.

Test 3: Sustained Stress and Concurrency Limits with PHP-FPM

The third test was designed to simulate a production scenario where requests come in after the system has been running for a while. This test helps highlight if performance degrades over time, or if some droplets show fatigue under repeated use. Surprisingly, srv1 continued to outperform every other droplet — delivering its fastest responses yet. PHP-FPM’s process management clearly improved not just raw speed, but long-term request handling stability.

HostnameRegionCPURAMReq/secMedian Resp Time (ms)Total Time (s)Max Resp Time (ms)
srv1NYC3AMD1 GB2.05479339.119499
srv2SGP1AMD1 GB1.58587550.679293
srv100NYC1AMD2 GB1.80532944.337874
srv1000NYC3Intel1 GB1.57577450.988562

  • srv1 (1GB, AMD) improved even further — now handling 2.05 RPS with the lowest median latency yet (4793 ms). Its consistency across three rounds confirms that PHP-FPM significantly boosts its capabilities, even without full-page caching.
  • srv2 remained the slowest performer, again with the longest median and max response times. This validates that regional latency and distance to the test origin (USA to Singapore) are critical for user-perceived speed.
  • srv100 (2GB, AMD) had its best round here, delivering 1.80 RPS with a median of 5329 ms — still slower than srv1, but a solid improvement over earlier runs.
  • srv1000 (1GB, Intel) returned to being the slowest of the NYC-based droplets in terms of median latency, though it stayed competitive in throughput. It seems to benefit from PHP-FPM but still lacks the raw efficiency of AMD droplets.

Test 4: Extreme Load Benchmark — 1000 Requests at 50 Concurrency

In this final stress test, I cranked up the load: 1,000 requests at 50 concurrent users. This was well beyond the safe zone I used in earlier tests — not because I expected the droplets to breeze through it, but to find their breaking points. Surprisingly, they didn’t break.

Every server completed the test without crashing or timing out, which was a dramatic contrast to the behavior I observed under PHP-CGI. PHP-FPM’s efficient process management clearly shines here, especially when dealing with large concurrent traffic. Even the 1GB droplets handled sustained load gracefully, showing that with the right stack, you don’t always need more RAM to stay online you just need better architecture.

HostnameRegionCPURAMReq/secMedian Resp Time (ms)Total Time (s)Max Resp Time (ms)
srv1NYC3AMD1 GB1.9825,104504.5328,540
srv2SGP1AMD1 GB1.5930,717629.5735,516
srv100NYC1AMD2 GB1.8127,405552.7232,100
srv1000NYC3Intel1 GB1.8227,179549.9731,840

  • srv1 (1GB, AMD) remained a top performer. Despite having the low RAM, it nearly hit 2 RPS again and delivered the lowest median response time (25,104 ms). Its ability to hold up under a load 12.5x higher than previous tests proves how much PHP-FPM helps small droplets scale under pressure.
  • srv2 (1GB, AMD, Singapore) once again lagged behind the pack. With a median latency of 30,717 ms and the highest max response time (35.5s), its performance confirms that network latency and region still heavily affect real-world load behavior — even with the same software stack.
  • srv100 (2GB, AMD) handled the load fairly well, but it was again outpaced by srv1 in both median and max response time. Its higher memory didn’t translate into better resilience at high concurrency, suggesting that CPU scheduling and regional differences may be factors.
  • srv1000 (1GB, Intel) actually surprised here. It beat srv100 in both total time and median latency, and slightly edged out in RPS too. This suggests that PHP-FPM helps flatten the performance gap between older Intel and newer AMD CPUs under sustained concurrency.

Visual Summary

php-fpm-comparison-all-tests
PHP-FPM performance benchmark — showing how each droplet handled increasing load through median response time and throughput.
  • srv1 (1GB AMD) consistently delivered the best balance of low latency and high throughput — even under extreme load.
  • srv2 (SGP1) was consistently the slowest, reinforcing the impact of geographic latency despite similar specs.
  • srv100 (2GB AMD) remained stable but never surpassed srv1, suggesting that PHP-FPM’s efficiency flattens the RAM advantage in these scenarios.
  • srv1000 (Intel) caught up by Test 4, proving that FPM helps older architecture stay competitive under stress.
php-cgi-vs-php-fpm-wordpress-performance
Side-by-side comparison of PHP-CGI and PHP-FPM performance across three tests, showing significant improvements with PHP-FPM.
  • PHP-FPM dramatically reduced response times across all droplets, especially for srv1 and srv100, where latency dropped by over 70%.
  • Requests per second nearly tripled in some cases, proving FPM’s ability to handle concurrent requests more efficiently.
  • srv1000 (Intel) saw the most improvement relative to its earlier performance, with RPS doubling and latency slashed by more than half.
  • srv2 remained the slowest in both cases, but still improved substantially — further confirming that backend stack optimizations can’t fully overcome physical distance from users.

Real-World Performance Insights

Beyond raw benchmark numbers, I also measured how the stack performs under real-world conditions — including WordPress Query Monitor metrics and first-request wait times from Pingdom (tested from San Francisco, USA).

  • srv1 had the highest page load time (0.92s) despite strong backend performance. Its wait time of 831ms suggests frontend TTFB (Time to First Byte) still has room for optimization — possibly due to Redis cold starts or initial PHP process warmup.
  • srv2 reported the fastest page load (0.69s) but the longest network wait time (1464ms). This mismatch is common for remote regions like Singapore where backend response is quick, but physical distance adds major latency.
  • srv100 achieved the best balance overall: low total load time (0.87s), lowest backend processing time (0.02s), and a very fast 753ms wait time — making it the most “snappy” experience from the user’s perspective.
  • srv1000, the Intel-based droplet, surprised with a strong frontend performance — just 745ms wait and a total load time of 0.81s. This reinforces that FPM closes the performance gap for older architecture in practical scenarios.
wordpress-pingdom-querymonitor-performance-comparison
Comparison of frontend user experience using Pingdom wait times and Query Monitor load times across all droplets.
  • srv2 loaded fast internally but suffered from high external wait times — highlighting how geographic latency affects international visitors.
  • srv100 offered the best balance of backend efficiency and frontend responsiveness.
  • srv1000 again proved that older hardware can keep up — with a strong showing in user-facing speed.
  • srv1 was slightly slower in perceived speed despite strong backend throughput, showing how small factors like PHP warmup and Redis cache state can impact TTFB.

Conclusion

After benchmarking the same WordPress site across four Digital Ocean droplets — first with PHP-CGI, then with PHP-FPM — the results speak for themselves.

PHP-FPM didn’t just improve performance; it transformed the way each server handled traffic, concurrency, and user experience. Even the modest 1GB droplets, like srv1, consistently outperformed their earlier selves. Median response times dropped by over 70%, requests per second nearly tripled, and none of the servers crashed — even under intense 1,000-request, 50-concurrent-user loads.

Notably, srv100, with 2GB of RAM, delivered the most balanced frontend and backend experience, while srv1000 (Intel-based) proved that smart stack choices can make older hardware surprisingly competitive. The consistent lag from srv2 reminded me that server region still plays a huge role in real-world speed — especially when targeting specific geographies.

If you’re serious about WordPress performance, switching from PHP-CGI to PHP-FPM is a no-brainer. And if you want real results, benchmark your own setup — because the spec sheet doesn’t tell the whole story.

Need Help?

I help developers and teams build fast, secure, and scalable systems — from WordPress to APIs, and from LAMP stacks to mobile apps. Whether it’s performance tuning, infrastructure, or DevOps support, I’ve got you covered.

Try DigitalOcean with $200 in free credit or get in touch to start your project.

WordPress Performance on Digital Ocean: Full Stack with Apache, NGINX & Redis

wordpress-droplet-performance-benchmark

Setting up a WordPress site on a fresh VPS is easy — any developer can spin up a droplet and install a theme. But running a real WordPress site is a different challenge. I’m talking about a professional-grade setup with 27 plugins, full-page caching, Redis for object caching, and a dual web server configuration using both Apache and NGINX. This isn’t a clean demo install — it’s a realistic, heavy site that mirrors what many agencies, developers, and growing businesses deploy in production.

In this article, I take that kind of real-world WordPress stack and benchmark it across four different DigitalOcean droplets — each with different CPU architectures, RAM sizes, and regions. It’s the follow-up to my earlier Digital Ocean Droplet Performance Benchmark, where I tested raw CPU, RAM, disk, and network performance. But this time, the focus is squarely on application-level performance: how fast WordPress responds, how well caching behaves, and how stack choices like Redis and PHP 8.2 affect performance under real traffic conditions.

Missed the First One? Want to See What’s Next?

Let’s first revisit the droplet configurations:

HostnameRegionCPU TypeRAMDiskOS
srv1NYC3AMD1 GB25 GB SSDAlmaLinux 9
srv2SGP1AMD1 GB25 GB SSDAlmaLinux 9
srv100NYC1AMD2 GB50 GB SSDAlmaLinux 9
srv1000NYC3Intel1 GB25 GB SSDAlmaLinux 9

Test Setup:

Each droplet was configured with a full WordPress stack designed to mirror a real production site — not a minimal install, but a fully featured setup. Here’s what was running on each server:

  • Apache 2.4.62 with NGINX as a reverse proxy
  • PHP 8.2.0 with Opcache enabled for faster execution
  • MariaDB 10.5.27 as the database engine
  • Redis configured for object caching
  • A full WordPress site featuring:
    • 40 pages
    • 27 plugins (25 active during testing)
    • A fully loaded theme with custom blocks and custom post types
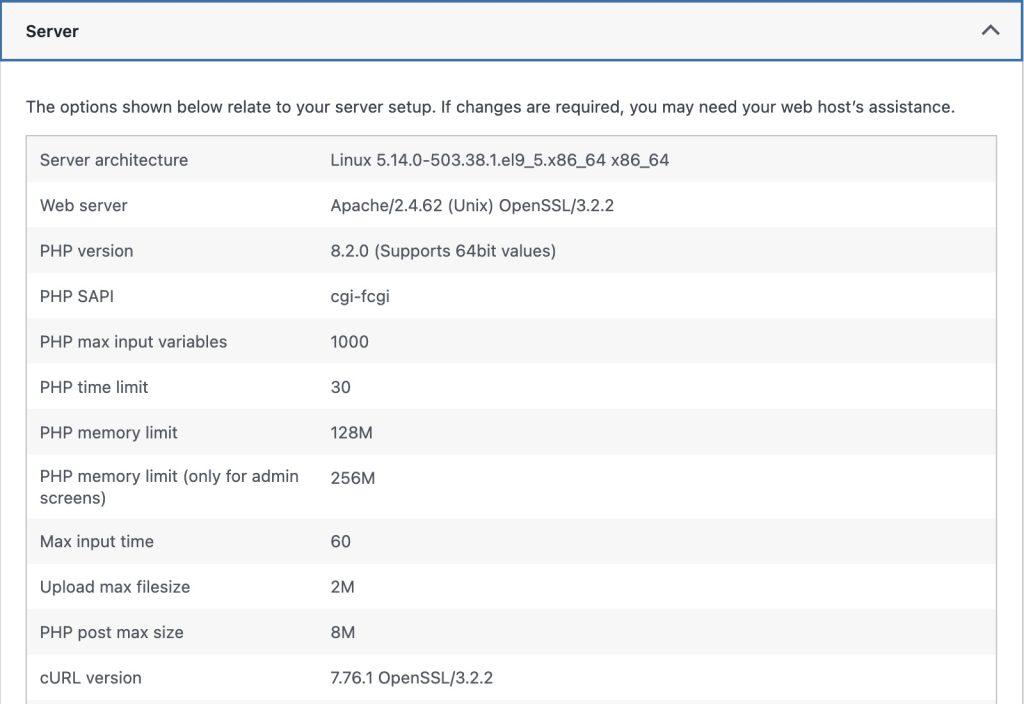
wordpress-server-info-digitalocean
Environment summary from WordPress Site Health

Benchmark Results

To understand how each droplet handles real-world WordPress load, I ran three rounds of controlled performance tests. Each test simulated traffic to a production-grade site with 27 plugins, Redis caching, and no full-page cache. Results highlight not just peak performance, but also stability, consistency, and how well each server handles stress over time.

Test 1: Initial WordPress Performance

This test simulated real-world traffic on WordPress site running PHP-CGI. I began with moderate concurrency — just 10 users and 80 requests — after discovering that pushing these droplets harder would quickly crash services or make the VPS completely unresponsive. In fact, I had to repeat test multiple times (up to 5) to find the sweet spot that wouldn’t overwhelm the system while still revealing performance characteristics.

HostnameRegionCPURAMReq/secMedian Resp Time (ms)Total Time (s)Max Resp Time (ms)
srv1NYC3AMD1 GB0.3628,093223.239,413
srv2SGP1AMD1 GB0.2635,644312.960,429
srv100NYC1AMD2 GB0.6614,825121.518,115
srv1000NYC3Intel1 GB0.2932,983273.144,667

  • srv100 (2GB RAM, AMD) was clearly the fastest — it handled the requests more than twice as quickly as the next-best droplet.
  • srv1 (1GB, AMD) did OK, but it started to slow down under even light load. Its median response time was nearly 2x slower than srv100, likely due to limited memory and the inefficiency of PHP-CGI.
  • srv1000 (1GB, Intel) was slower than the AMD-based droplets in every metric. Intel’s legacy droplet performance just doesn’t hold up.
  • srv2 (1GB, AMD, Singapore region) had the worst performance, with extremely long response times and the longest test duration. The likely causes are:
    • Higher SSL handshake or connect time (700ms+)
    • Slower network to the test machine

Test 2: Stability Check Under Repeat Load

This round re-ran the same test on the same stack to check for consistency and stability under stress. Once again, concurrency was kept at 10 and requests at 80, as anything more would destabilize the server — in some cases forcing a reboot.

HostnameRegionCPURAMReq/secMedian Resp Time (ms)Total Time (s)Max Resp Time (ms)
srv1NYC3AMD1 GB0.3527,810229.9044,039
srv2SGP1AMD1 GB0.2539,410326.2449,217
srv100NYC1AMD2 GB0.7014,230114.9315,266
srv1000NYC3Intel1 GB0.3131,026256.6942,377

  • srv100 remained the fastest and most stable, with even lower total time — showing consistent efficiency under pressure.
  • srv1 showed stable behavior but a slight creep in response times, likely from cumulative load or thermal throttling.
  • srv1000 improved very slightly in max latency, but AMD droplets still easily outpaced it.
  • srv2 continued to underperform. Network latency and CPU limitations in this region seem to be persistent bottlenecks.

Test 3: Sustained Stress and Concurrency Limits

In this third round, I continued using the same 10-concurrency, 80-request model to simulate consistent pressure. Anything more still caused service timeouts or PHP crashes, so I stayed within known-safe limits. This final run aimed to confirm patterns and uncover any performance degradation over time.

HostnameRegionCPURAMReq/secMedian Resp Time (ms)Total Time (s)Max Resp Time (ms)
srv1NYC3AMD1 GB0.2936,271272.3851,648
srv2SGP1AMD1 GB0.2538,925320.0761,171
srv100NYC1AMD2 GB0.6914,429115.5916,673
srv1000NYC3Intel1 GB0.2933,587272.7343,609

  • srv100 remained the only droplet that comfortably handled repeated load, showing excellent consistency over all three tests.
  • srv1 performance degraded slightly in this round, indicating it may be close to its resource limit even with moderate traffic.
  • srv1000 was slightly more stable than expected but still underwhelming.
  • srv2 now clocked the worst response times yet — hitting a 61-second max latency.

Monitoring Graphs Summary

To complement the raw performance data, I captured resource usage metrics during each test run. These graphs provide a behind-the-scenes look at how each server handled CPU load, memory usage, and disk I/O under stress. In some cases, they helped explain slowdowns that weren’t obvious from response times alone — like CPU saturation, inefficient caching, or regional latency. Together, they offer a complete picture of how infrastructure and application behavior intersect.

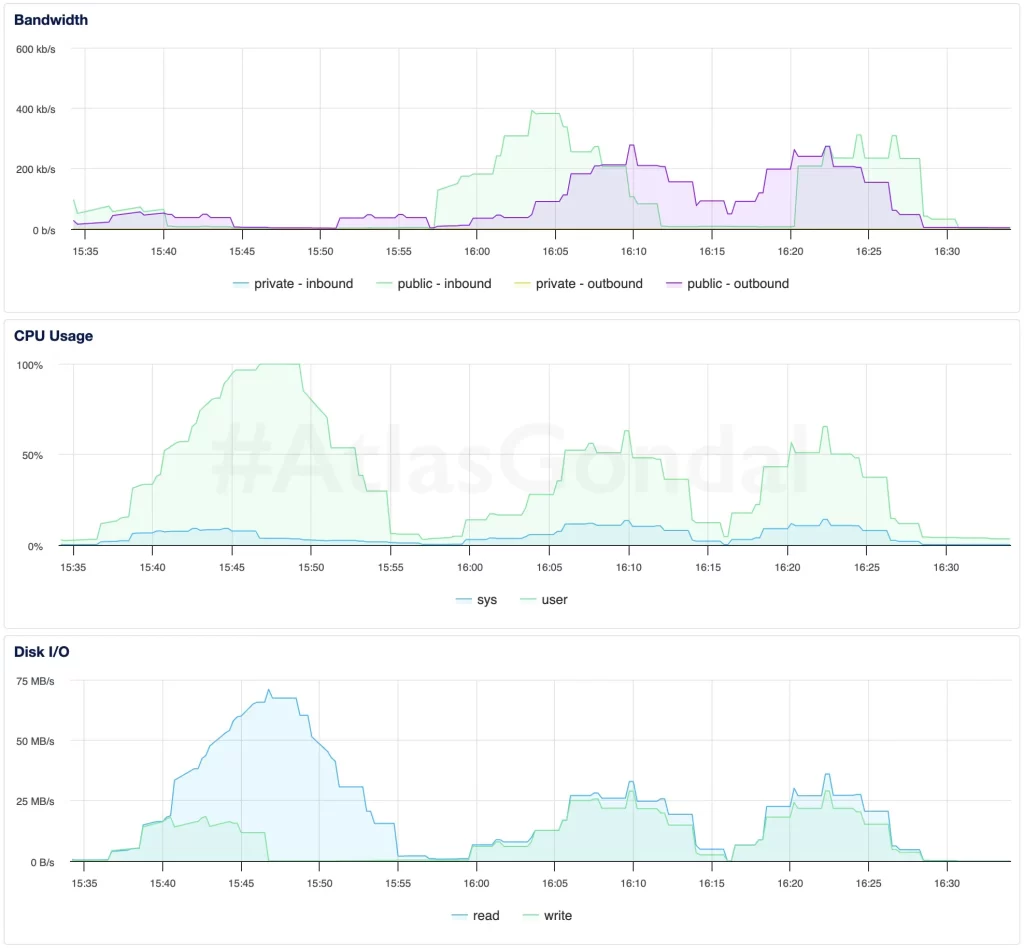
1. srv1: (1 GB AMD, NYC3)

srv1-performance-metrics
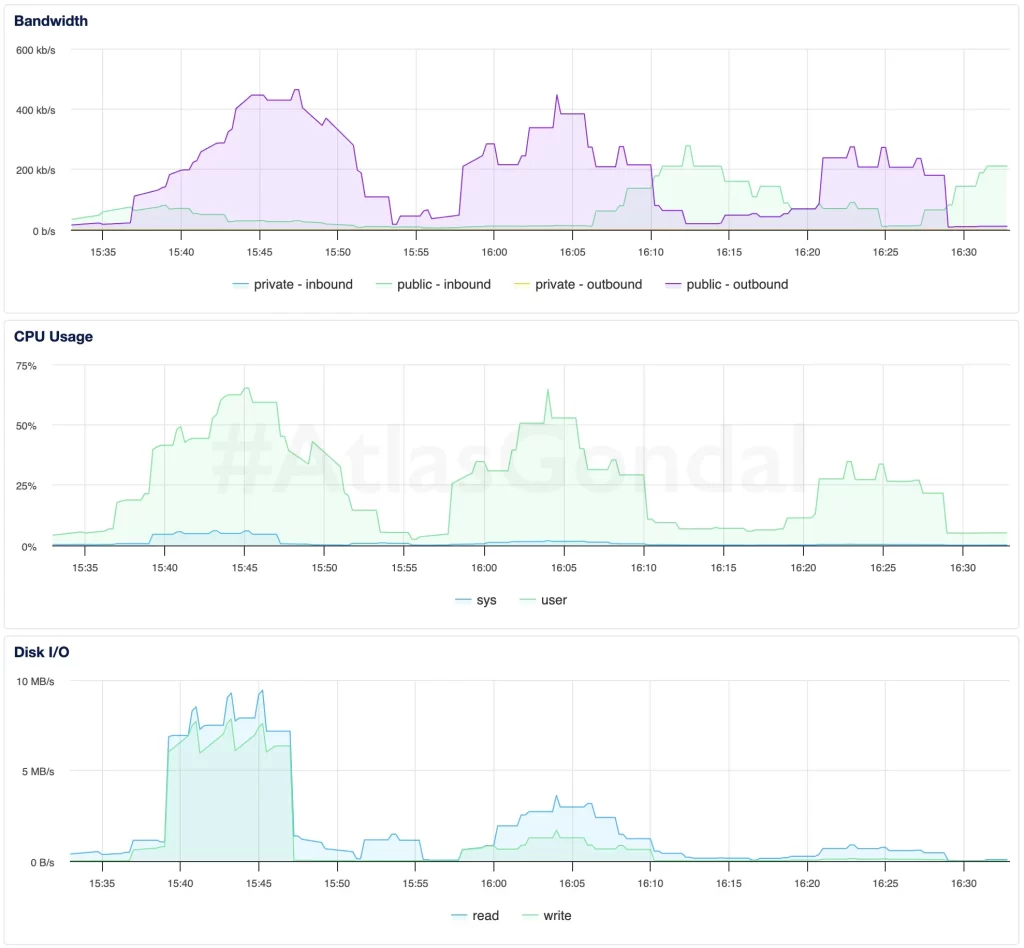
Resource usage on srv1 (1GB, AMD) during Test. CPU saturation visible; disk I/O limited.
  • CPU usage hits 100% during peak periods — a clear sign that PHP-CGI can’t scale on small instances.
  • Disk I/O remained moderate; bottleneck is likely PHP or memory, not storage.

2. srv2: (1 GB AMD, SGP1)

srv2-performance-metrics
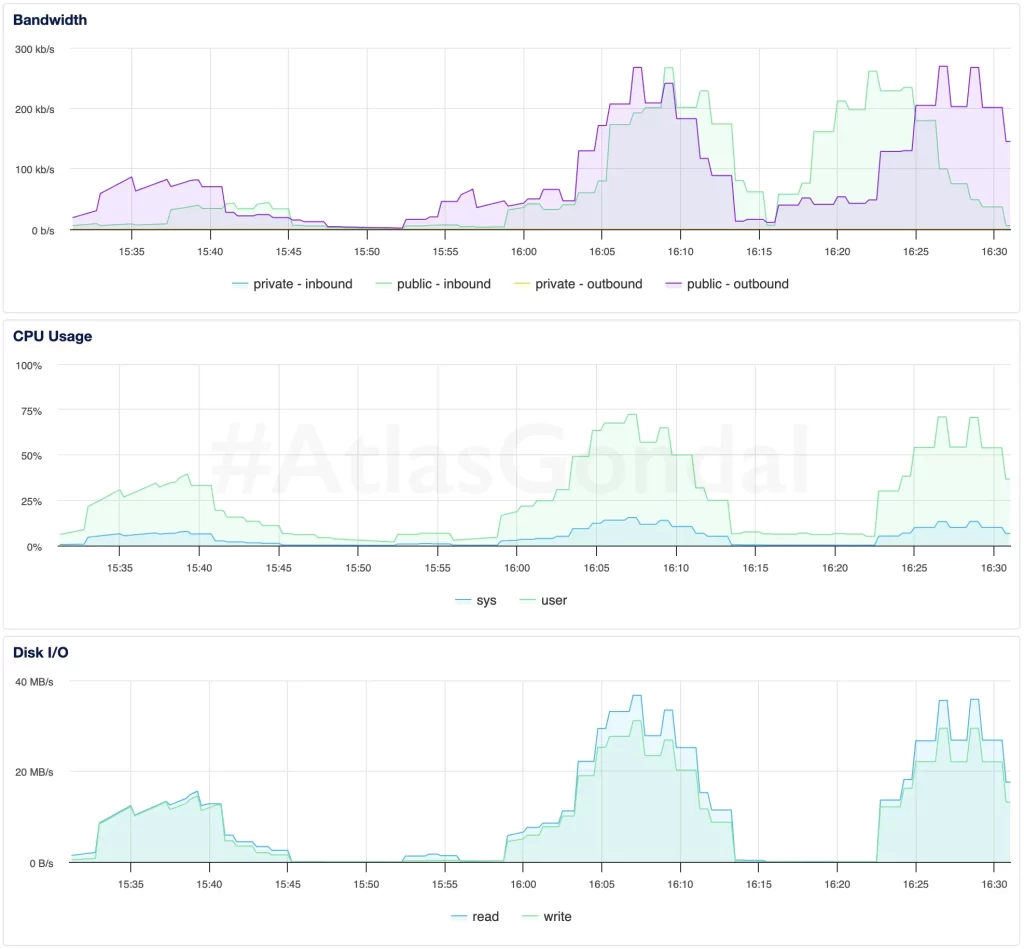
srv2 (1GB, AMD, Singapore) shows inconsistent CPU utilization and lower throughput.
  • Network latency and inconsistent CPU usage suggest external or regional factors are impacting performance.
  • Disk activity is low, indicating delays are not from storage but processing/network.

3. srv100: (2 GB AMD, NYC1)

srv100-performance-metrics
srv100 (2GB, AMD) showed smooth CPU and I/O behavior — the most balanced and efficient.
  • CPU remained under 70%, disk I/O was consistent, and request handling was predictable.
  • Excellent resource balance — ideal candidate for production workloads.

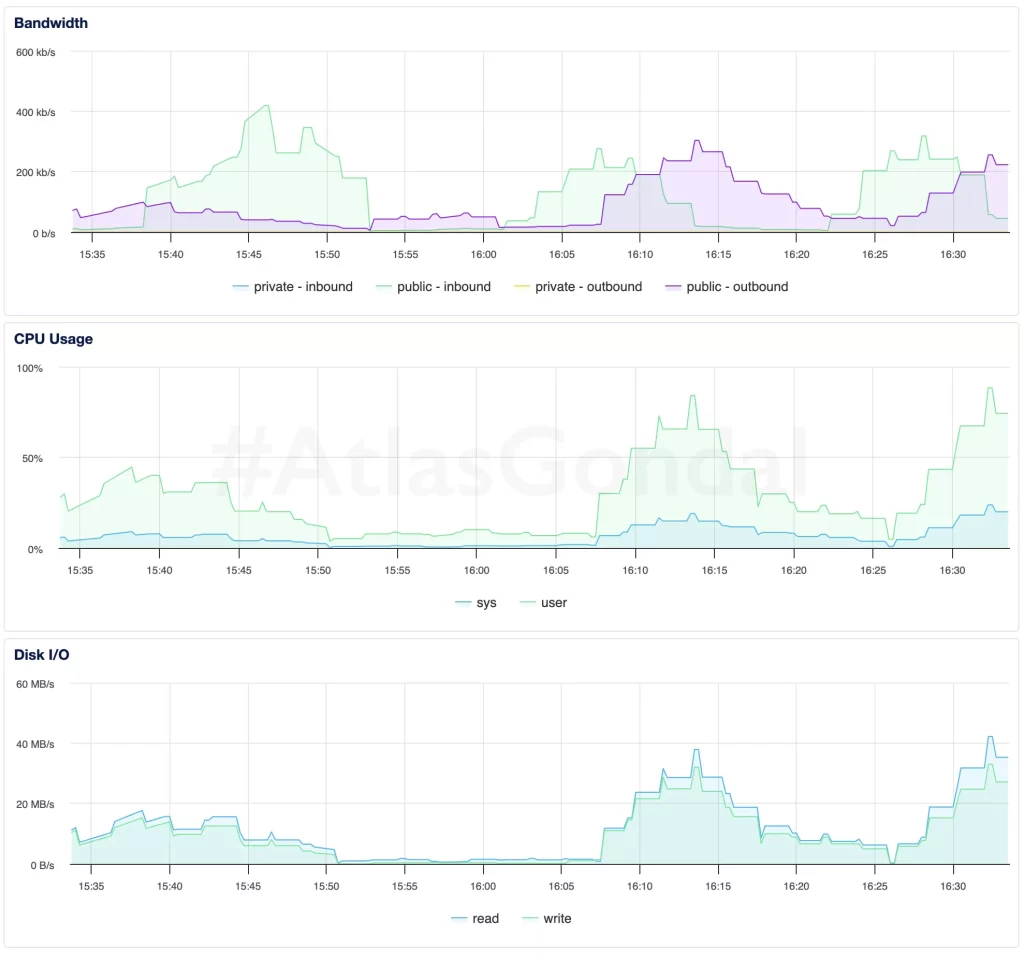
4. srv1000: (1 GB Intel, NYC3)

srv1000-performance-metrics
srv1000 (1GB, Intel) used more disk I/O than others and showed inconsistent CPU spikes.
  • Higher disk usage might indicate inefficient caching or database behavior.
  • Intel-based droplets don’t scale well for WordPress workloads under concurrency.

Additional Application-Level Metrics

To go beyond server-side concurrency and latency, I also captured WordPress-level performance using Query Monitor and real-world frontend timing using Pingdom Tools with San Francisco (USA) Server. These metrics reveal how PHP execution, memory usage, and network latency impact actual page load experience.

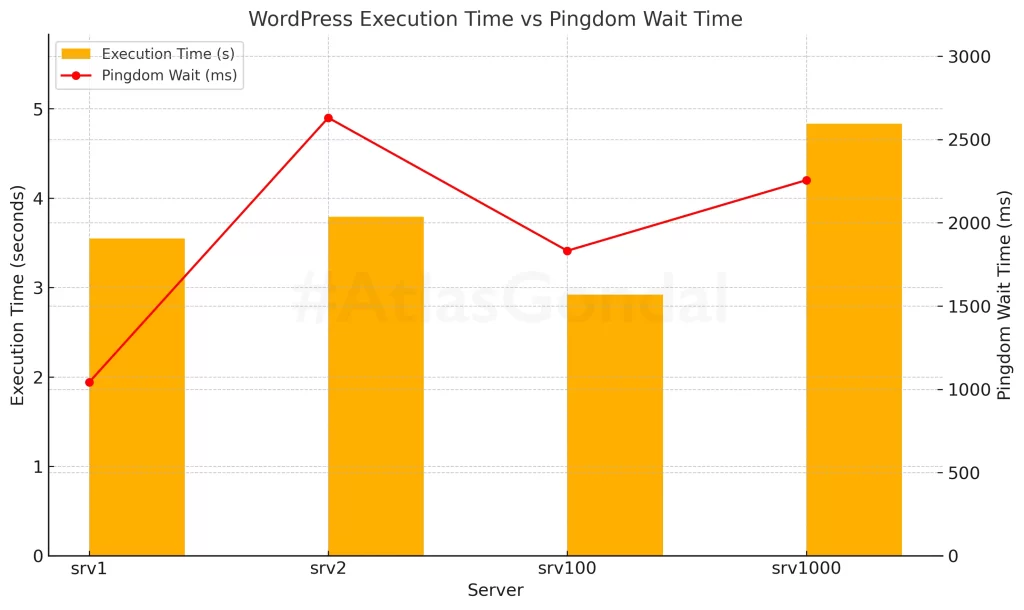
  • srv100 (2GB, AMD) had the fastest total load time (2.92s) and one of the lowest wait times (1832 ms). It’s the most balanced performer both server-side and client-side.
  • srv1 and srv2 were close in terms of backend performance (around 3.5–3.8s), but srv2 had the highest frontend wait time (2631 ms) — likely due to geographical distance or slower initial connection.
  • srv1000 (1GB, Intel) was the worst in both backend and frontend metrics — with the highest execution time (4.83s) and elevated wait time (2256 ms). This aligns with earlier benchmarks showing CPU and memory inefficiencies.
  • All droplets used similar memory (~32MB) and executed ~52–57 queries, indicating that performance differences stem mostly from infrastructure and latency, not app configuration.
wordpress-execution-vs-pingdom-wait
Execution time measured by Query Monitor vs. initial wait time reported by Pingdom (San Francisco test location).
  • srv100 had both the lowest execution time (2.92s) and a solid wait time (1832ms) — making it the most responsive overall.
  • srv2 suffered from the highest frontend wait (2631ms), highlighting regional latency.
  • srv1000 had the slowest backend execution (4.83s), further proving that Intel-based droplets lag in WordPress-heavy environments.

Conclusion

After three rounds of real-world WordPress benchmarking, deep stack monitoring, and client-side testing, the verdict is clear: infrastructure choices matter more than the spec sheet suggests.

srv100 (2GB AMD, NYC1) was consistently the top performer in every test. It not only handled concurrency better but maintained stable performance across all metrics — backend, frontend, and system-level resource usage. It’s the kind of VPS I’d confidently run production workloads on.

On the other hand, srv1 and srv1000, both 1GB droplets (AMD and Intel respectively), showed that 1GB RAM is a tight squeeze for plugin-heavy WordPress stacks — especially when running under PHP-CGI. Performance dipped under repeated load, and the system often hovered near failure. Enabling PHP-FPM and caching in a future test will likely bring major improvements.

srv2 (AMD, Singapore) consistently had the worst performance despite similar specs. Regional latency and SSL handshake delays played a role, showing that geography and network routing can be just as important as RAM or CPU when it comes to global performance.

These tests reinforced that benchmarking isn’t optional. No matter how similar your droplets appear on paper, real workloads reveal real differences.

Need Help?

If you’re building more than a blog — whether it’s a custom API, e-commerce site, or enterprise SaaS platform — and you care about speed, reliability, and scalability, I can help.

I offer services in:

  • Performance tuning for WordPress, Laravel, Node.js, and Django
  • Infrastructure setup and automation for LEMP/LAMP stacks
  • Penetration testing and server hardening for security-critical applications
  • Mobile and web development (React, Flutter, Vue, Next.js)
  • Ongoing sysadmin and DevOps support for scaling or recovering servers

Get in touch to build something that runs fast and doesn’t fall over. Also, if you want to try Digital Ocean with $200 in free credit? Sign up using my referral link here.

Export All URLs – Efficient URL Management for WordPress

Export All URLs

Managing a WordPress website can be a daunting task, especially when it comes to handling and organizing URLs. Whether you’re a seasoned webmaster or a beginner, the Export All URLs plugin for WordPress is an essential tool that simplifies URL management, enhances SEO efforts, and ensures a seamless content migration process. In this article, we’ll explore the key features, benefits, and practical applications of the Export All URLs plugin, and how it can make your WordPress website management quick and simple.

Key Features

The Export All URLs plugin offers a range of features designed to make URL management straightforward and efficient. One of the standout features is its ability to extract URLs from various parts of your WordPress site, including posts, pages, and custom post types. This approach ensures that no URL is left behind, providing a complete list for your needs.

Customization is another major advantage of the Export All URLs plugin. You can tailor the export process to suit your specific requirements by selecting particular post types, filtering by categories and tags, and including additional metadata such as post titles, IDs, and statuses. This level of customization makes it an invaluable tool for SEO professionals who need detailed URL data for analysis, seo, security and optimization.

Simplifying SEO and Content Migration

One of the primary uses of the Export All URLs plugin is to enhance your site’s SEO. By providing a complete list of your site’s URLs, you can easily identify and optimize your URL structure, ensuring better search engine rankings. The ability to export URLs in CSV and TXT formats allows for easy integration with SEO tools and software, facilitating a more efficient optimization process.

The content migration is another area where the Export All URLs plugin shines. When moving content from one site to another, having a complete list of URLs ensures that all links are accounted for, reducing the risk of broken links and maintaining the integrity of your site’s structure. This feature is particularly useful for web developers and content managers overseeing large-scale migrations.

Backup and Security

Creating backups of your site’s URLs is crucial for maintaining site security and integrity. The Export All URLs plugin allows you to generate a comprehensive backup of all URLs, ensuring you have a safety net in case of data loss or site changes. This feature provides peace of mind, knowing that you have a reliable record of all your site’s links.

Easy Installation and Compatibility
Installing and using the Export All URLs plugin is fairly straight forward task, as proven by over few dozens of reviews. Simply navigate to the WordPress plugin repository, search for “Export All URLs,” and click install. Once activated, the plugin integrates seamlessly with your WordPress dashboard, providing a simple and intuitive interface for managing URL exports. The plugin is designed to be compatible with almost all WordPress themes and plugins, and regular testing & updates ensure any discovered issue is fixed at priority.
Conclusion

In conclusion, the Export All URLs plugin is an indispensable tool for any WordPress user looking to streamline URL management, enhance SEO efforts, and ensure smooth content migration. Its features, ease of use, and robust customization options make it a must-have for webmasters, SEO professionals, and content managers alike.

By integrating the Export All URLs plugin into your WordPress toolkit, you can take control of your site’s URLs, optimize your SEO strategy, and safeguard your content. Don’t let URL management become a daunting task, simplify it with the Export All URLs plugin and enjoy a more organized and efficient WordPress experience.

Changelog
4.7.1
  • Compatibility – test with WordPress 6.7-alpha-58656
4.7
  • Added – support for the translation
  • Compatibility – tested with WordPress 6.4
  • Improvement – better organization and several code refinements
4.6
  • Fixed – reflected cross-site scripting vulnerability
  • Compatibility – tested with WordPress 6.2.2
4.5
  • New – additional export fields added (tags, author, published, and modified date)
  • New – option to retain selected options (no reset to default upon exporting)
  • Improvement – backend code refinement
  • Compatibility – minor adjustments for PHP 8.1 compatibility
  • Compatibility – tested with WordPress 6.2
4.4
  • Added – additional verification for file removal to patch a security issue
  • Compatibility – tested with wordpress 6.0.1
4.3
  • Added – overall security and stability improvements
  • Compatibility – tested with wordpress 5.9.2
4.2
  • Fixed – patched a security vulnerability
  • Removed – file path customization option
  • Compatibility – tested with wordpress 5.9.1 & PHP 8.1
4.1
  • Added – option to remove woo commerce extra attributes from categories
  • Tweak – bit of formatting adjustments
  • Added – some default settings
  • Compatibility – tested with wordpress 5.4.2
4.0
  • Added – export post IDs
  • Added – exclude domain URL
  • Added – complete support of custom post type categories
  • Tweak – small dashboard design improvements
  • Added – enables user to delete the file once downloaded
  • Compatibility – wordpress 5.4 and php 7.3
  • Tweak – migrated under tools options, instead of settings
  • Added – displays total number of links
  • Added – new easy ways to report problem or bug
  • Fixed – conflict with “Security Header” & “Elementor” plugin
  • Fixed – typo on settings page
  • Added – extra verification checks
3.6
  • Added – filter data by date range
  • Tweak – some general activation improvements
  • Compatibility – tested with 5.1.1
3.5
  • Added – allow users to customize file path and file name
  • Fixed – grammatical mistake
  • Compatibility – tested with 4.9.7
3.0
  • Added – filter data by author
  • Added – specify post range for extraction
  • Added – generates random file name
  • Compatibility – tested with 4.9.2
2.6
  • Fixed – variable initialization errors
  • Compatibility – tested with 4.9
2.5
  • Added – support for selecting post status
  • Compatibility – tested with 4.7.5
2.4
  • Fixed – fatal error bug fixed
  • Compatibility – tested with wordpress 4.7.2
2.3
  • Fixed – categories export, (only first category was exporting)
  • Compatibility – tested with wordpress 4.7
2.2
  • Added – support for wordpress 4.6.1
2.1
  • Fixed – special character exporting for Polish Language
2.0
  • Added – support for exporting title and categories
1.0
  • initial release