Setting up WordPress is easy task. Tuning it to run fast under real-world pressure? That’s where things get serious. In my previous article, I tested a heavy, production-grade WordPress stack on four Digital Ocean droplets — using Apache, NGINX, Redis, and PHP 8.2, with the app running under PHP-CGI. The results were eye-opening: even modest traffic loads exposed performance bottlenecks in lower-memory VPS setups.
Now, I’ve taken that exact same stack — same WordPress site, same plugins, same VPS hardware — and rebuilt it to run on PHP-FPM instead of PHP-CGI. This article picks up right where the last left off, benchmarking WordPress performance with a much more efficient process manager behind the scenes. I wanted to find out just how much of a difference PHP-FPM makes, especially on constrained 1GB and 2GB droplets across different CPU types and regions.
Missed the Earlier Tests? Catch Up Here:
- Part 1: Digital Ocean Droplet Performance Benchmark
- Compared raw CPU, RAM, disk, and network across AMD vs Intel, NYC vs SGP regions.
- Part 2: WordPress Performance with Apache, NGINX, Redis & PHP-CGI
- Full LAMP stack test with real plugins, caching, and real-world application pressure.
Let’s start by revisiting the droplet configurations I’ve been using throughout this series:
| Hostname | Region | CPU Type | RAM | Disk | OS |
srv1 | NYC3 | AMD | 1 GB | 25 GB SSD | AlmaLinux 9 |
srv2 | SGP1 | AMD | 1 GB | 25 GB SSD | AlmaLinux 9 |
srv100 | NYC1 | AMD | 2 GB | 50 GB SSD | AlmaLinux 9 |
srv1000 | NYC3 | Intel | 1 GB | 25 GB SSD | AlmaLinux 9 |
Test Setup:
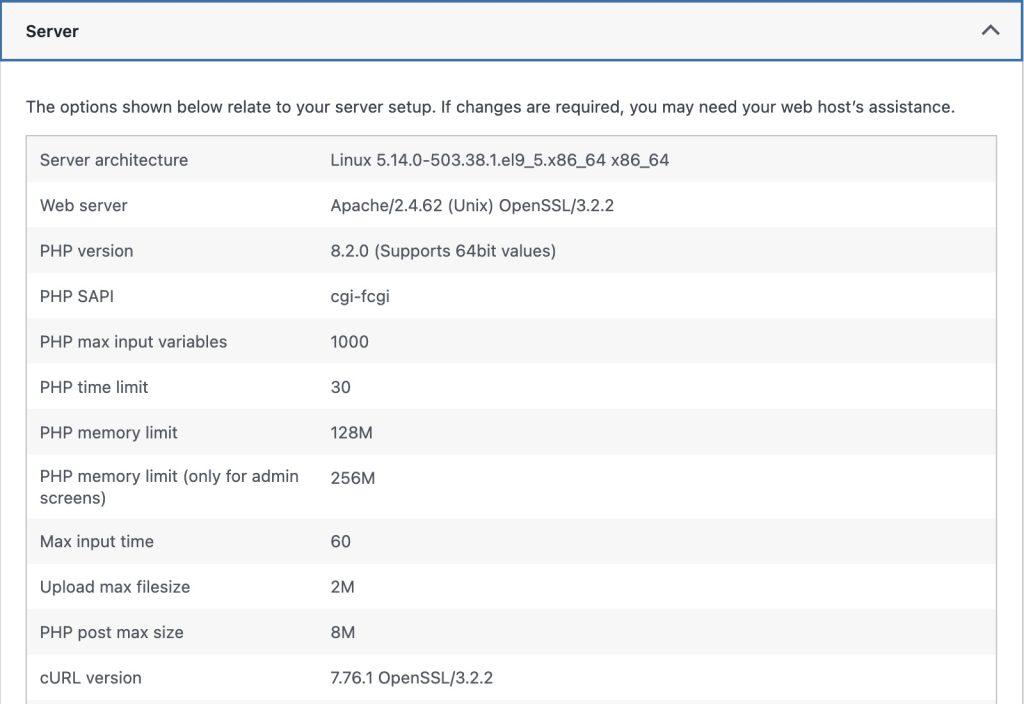
For this round of testing, I am using the same production-grade WordPress stack across four Digital Ocean droplets — but this time powered by PHP-FPM instead of PHP-CGI. The goal was to evaluate how this modern, efficient PHP handler affects performance under identical conditions.
Each droplet was configured to replicate a real-world WordPress environment, here’s the full stack:
- NGINX as reverse proxy paired with Apache 2.4.62
- PHP 8.2.0 running via PHP-FPM, with Opcache enabled for execution speed
- MariaDB 10.5.27 handling the database layer
- Redis configured for persistent object caching
- A full-featured WordPress site includes:
- 40 pages of content
- 27 plugins (25 active during testing)
- A fully loaded theme with custom blocks and custom post types
Benchmark Results
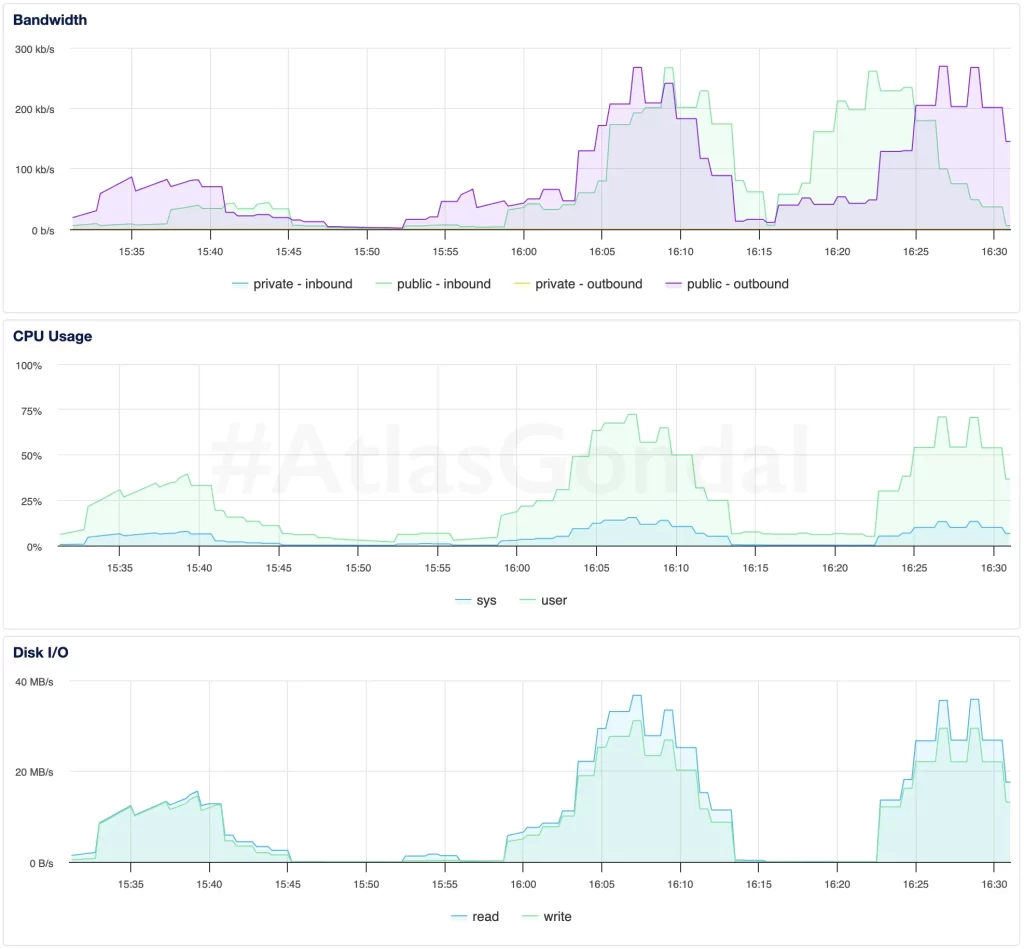
To understand how each droplet handles real-world WordPress load, I ran three rounds of controlled performance tests. Each test simulated traffic to a production-grade site with 27 plugins, Redis caching, and no full-page cache. Results highlight not just peak performance, but also stability, consistency, and how well each server handles stress over time.
Test 1: Initial WordPress Performance with PHP-FPM
This was the first run using the newly optimized stack with PHP-FPM enabled instead of PHP-CGI. I kept the same conditions — 10 concurrent users and 80 total requests — to ensure a fair comparison. What changed was how the servers responded: unlike before, there were no stalls or bottlenecks, and even 1GB droplets handled the traffic without reaching their breaking point. It immediately became clear that PHP-FPM brings serious efficiency gains, even without altering anything else in the stack.
| Hostname | Region | CPU | RAM | Req/sec | Median Resp Time (ms) | Total Time (s) | Max Resp Time (ms) |
srv1 | NYC3 | AMD | 1 GB | 1.93 | 4954 | 41.4 | 8993 |
srv2 | SGP1 | AMD | 1 GB | 1.54 | 6191 | 51.8 | 9851 |
srv100 | NYC1 | AMD | 2 GB | 1.7 | 5600 | 47.1 | 9998 |
srv1000 | NYC3 | Intel | 1 GB | 1.74 | 5168 | 45.9 | 9417 |
srv1(1GB, AMD) handled nearly 2 requests/sec with a median response time of 4954ms, outperforming its previous PHP-CGI result by a wide margin. For a 1GB droplet, this is a strong showing and highlights the efficiency boost from PHP-FPM.srv2(1GB, AMD, Singapore) remained the slowest performer overall, with the longest median (6191ms) and max response time (9851ms). Despite having the same specs assrv1, regional latency and connection overhead continue to drag its numbers down.srv100(2GB, AMD) posted good results (1.70 RPS, 5600 ms median), but was slightly slower thansrv1in response time, which is unexpected. The higher memory may help under more load, but at this level, it seems less impactful.srv1000(1GB, Intel) was surprisingly efficient in this test. It tiedsrv100in requests/sec and even slightly beat it in median latency, suggesting PHP-FPM helps mitigate some of Intel’s historical underperformance seen in earlier PHP-CGI tests.
Test 2: Stability Check Under Repeat Load (PHP-FPM)
This test was a repeat under identical conditions, used to measure consistency after the servers had time to “warm up” with PHP-FPM. Resource usage and performance patterns were more stable this time around. Median response times improved slightly in most cases, suggesting the stack was able to maintain performance under sustained but predictable load — something that caused significant slowdown or even failure under PHP-CGI.
| Hostname | Region | CPU | RAM | Req/sec | Median Resp Time (ms) | Total Time (s) | Max Resp Time (ms) |
srv1 | NYC3 | AMD | 1 GB | 2.00 | 4872 | 40.07 | 7562 |
srv2 | SGP1 | AMD | 1 GB | 1.56 | 6142 | 51.25 | 9650 |
srv100 | NYC1 | AMD | 2 GB | 1.74 | 5532 | 45.99 | 8937 |
srv1000 | NYC3 | Intel | 1 GB | 1.75 | 5202 | 45.76 | 8269 |
srv1(1GB, AMD) continued to lead with 2.00 requests/sec and a median response time of just 4872 ms — slightly faster than its Test 1 result. It also had the lowest total test time, confirming that FPM continues to benefit lower-memory droplets.srv2(1GB, AMD, SGP1) again trailed behind, with the highest latency (6142 ms median) and the slowest throughput (1.56 RPS). While slightly improved, network location and TLS handshake times remain limiting factors.srv100(2GB, AMD) held a respectable 1.74 RPS, but was outpaced bysrv1yet again in response times, which may suggest diminishing returns from RAM when the site isn’t heavily loaded.srv1000(1GB, Intel) surprisingly matchedsrv100in performance, with a median of 5202 ms and a respectable 1.75 RPS. This consistency implies PHP-FPM is evening out some of the architectural disadvantages seen in the PHP-CGI runs.
Test 3: Sustained Stress and Concurrency Limits with PHP-FPM
The third test was designed to simulate a production scenario where requests come in after the system has been running for a while. This test helps highlight if performance degrades over time, or if some droplets show fatigue under repeated use. Surprisingly, srv1 continued to outperform every other droplet — delivering its fastest responses yet. PHP-FPM’s process management clearly improved not just raw speed, but long-term request handling stability.
| Hostname | Region | CPU | RAM | Req/sec | Median Resp Time (ms) | Total Time (s) | Max Resp Time (ms) |
srv1 | NYC3 | AMD | 1 GB | 2.05 | 4793 | 39.11 | 9499 |
srv2 | SGP1 | AMD | 1 GB | 1.58 | 5875 | 50.67 | 9293 |
srv100 | NYC1 | AMD | 2 GB | 1.80 | 5329 | 44.33 | 7874 |
srv1000 | NYC3 | Intel | 1 GB | 1.57 | 5774 | 50.98 | 8562 |
- srv1 (1GB, AMD) improved even further — now handling 2.05 RPS with the lowest median latency yet (4793 ms). Its consistency across three rounds confirms that PHP-FPM significantly boosts its capabilities, even without full-page caching.
srv2remained the slowest performer, again with the longest median and max response times. This validates that regional latency and distance to the test origin (USA to Singapore) are critical for user-perceived speed.srv100(2GB, AMD) had its best round here, delivering 1.80 RPS with a median of 5329 ms — still slower thansrv1, but a solid improvement over earlier runs.srv1000(1GB, Intel) returned to being the slowest of the NYC-based droplets in terms of median latency, though it stayed competitive in throughput. It seems to benefit from PHP-FPM but still lacks the raw efficiency of AMD droplets.
Test 4: Extreme Load Benchmark — 1000 Requests at 50 Concurrency
In this final stress test, I cranked up the load: 1,000 requests at 50 concurrent users. This was well beyond the safe zone I used in earlier tests — not because I expected the droplets to breeze through it, but to find their breaking points. Surprisingly, they didn’t break.
Every server completed the test without crashing or timing out, which was a dramatic contrast to the behavior I observed under PHP-CGI. PHP-FPM’s efficient process management clearly shines here, especially when dealing with large concurrent traffic. Even the 1GB droplets handled sustained load gracefully, showing that with the right stack, you don’t always need more RAM to stay online — you just need better architecture.
| Hostname | Region | CPU | RAM | Req/sec | Median Resp Time (ms) | Total Time (s) | Max Resp Time (ms) |
srv1 | NYC3 | AMD | 1 GB | 1.98 | 25,104 | 504.53 | 28,540 |
srv2 | SGP1 | AMD | 1 GB | 1.59 | 30,717 | 629.57 | 35,516 |
srv100 | NYC1 | AMD | 2 GB | 1.81 | 27,405 | 552.72 | 32,100 |
srv1000 | NYC3 | Intel | 1 GB | 1.82 | 27,179 | 549.97 | 31,840 |
srv1(1GB, AMD) remained a top performer. Despite having the low RAM, it nearly hit 2 RPS again and delivered the lowest median response time (25,104 ms). Its ability to hold up under a load 12.5x higher than previous tests proves how much PHP-FPM helps small droplets scale under pressure.srv2(1GB, AMD, Singapore) once again lagged behind the pack. With a median latency of 30,717 ms and the highest max response time (35.5s), its performance confirms that network latency and region still heavily affect real-world load behavior — even with the same software stack.srv100(2GB, AMD) handled the load fairly well, but it was again outpaced bysrv1in both median and max response time. Its higher memory didn’t translate into better resilience at high concurrency, suggesting that CPU scheduling and regional differences may be factors.srv1000(1GB, Intel) actually surprised here. It beatsrv100in both total time and median latency, and slightly edged out in RPS too. This suggests that PHP-FPM helps flatten the performance gap between older Intel and newer AMD CPUs under sustained concurrency.
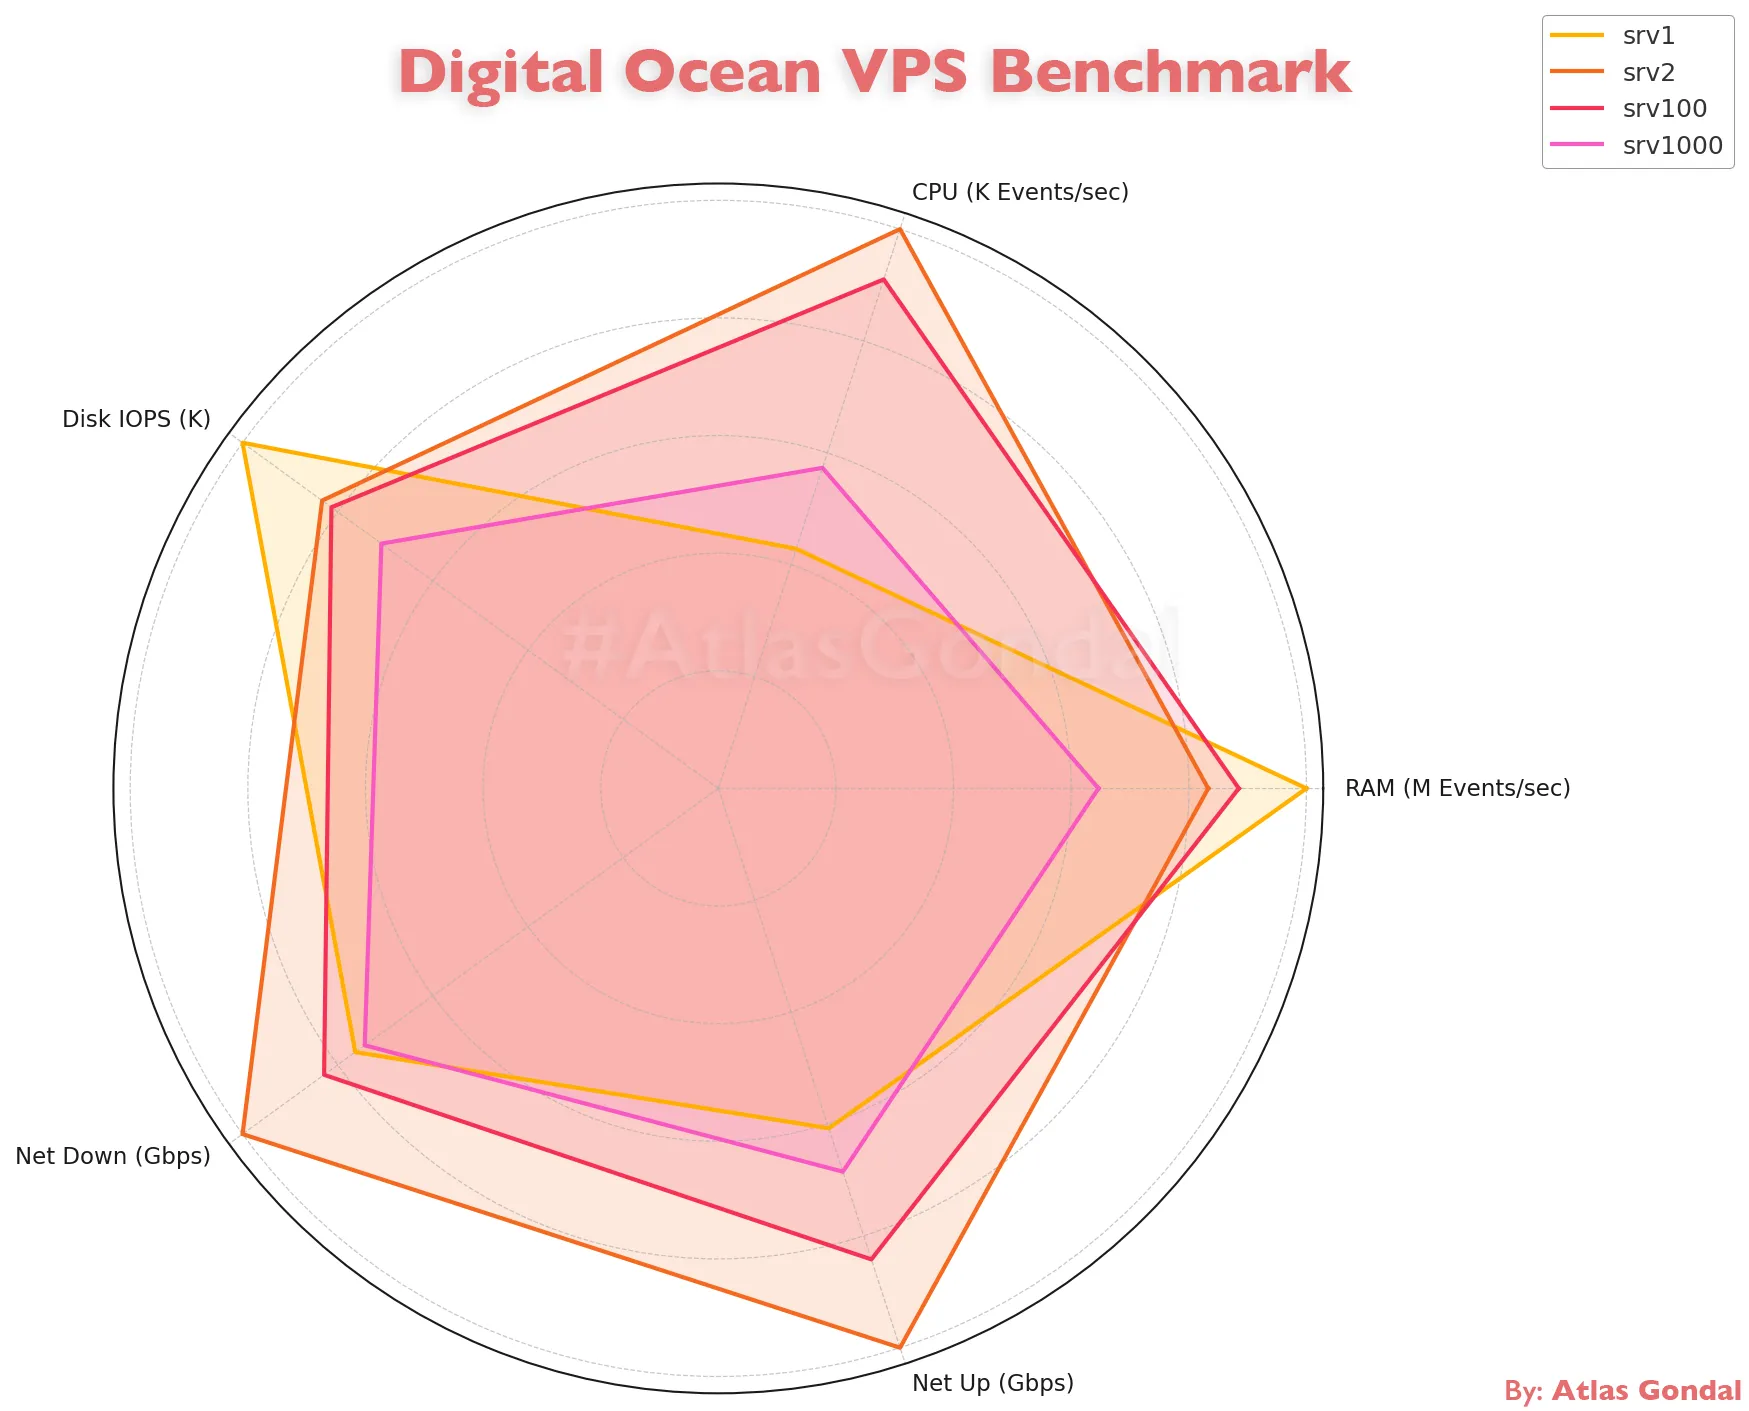
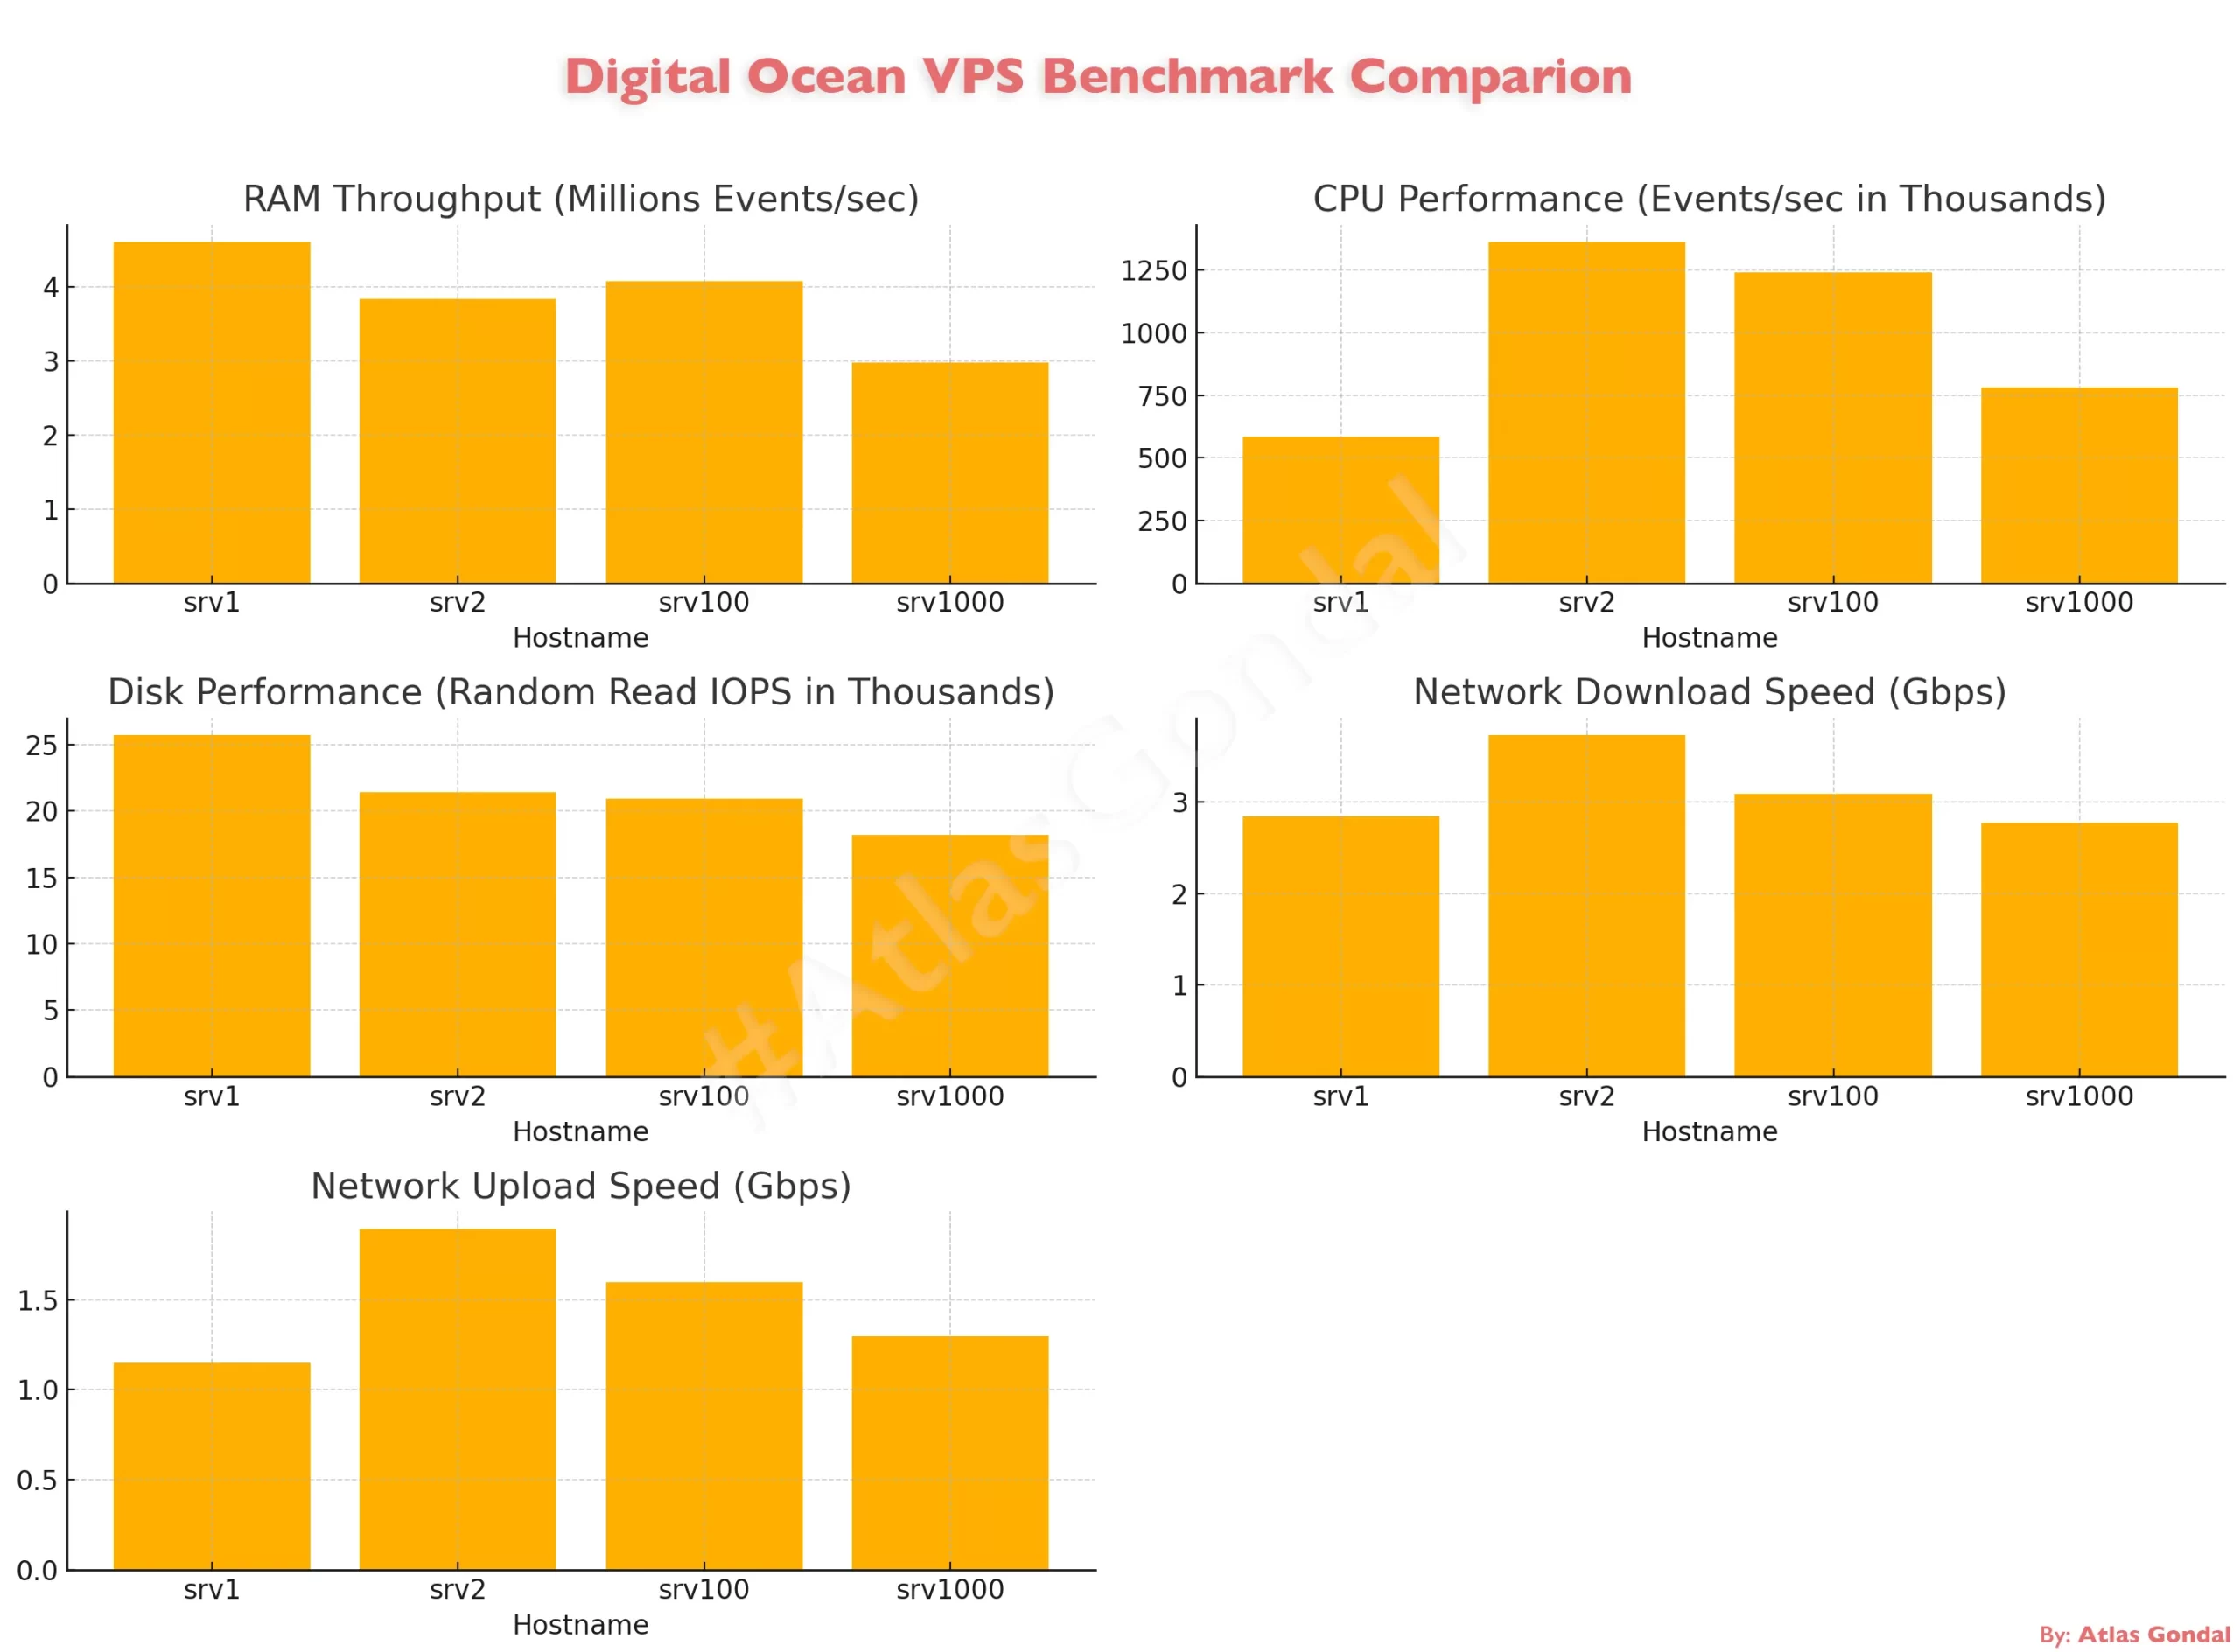
Visual Summary

srv1(1GB AMD) consistently delivered the best balance of low latency and high throughput — even under extreme load.srv2(SGP1) was consistently the slowest, reinforcing the impact of geographic latency despite similar specs.srv100(2GB AMD) remained stable but never surpassedsrv1,suggesting that PHP-FPM’s efficiency flattens the RAM advantage in these scenarios.srv1000(Intel) caught up by Test 4, proving that FPM helps older architecture stay competitive under stress.

- PHP-FPM dramatically reduced response times across all droplets, especially for
srv1andsrv100, where latency dropped by over 70%. - Requests per second nearly tripled in some cases, proving FPM’s ability to handle concurrent requests more efficiently.
srv1000(Intel) saw the most improvement relative to its earlier performance, with RPS doubling and latency slashed by more than half.srv2remained the slowest in both cases, but still improved substantially — further confirming that backend stack optimizations can’t fully overcome physical distance from users.
Real-World Performance Insights
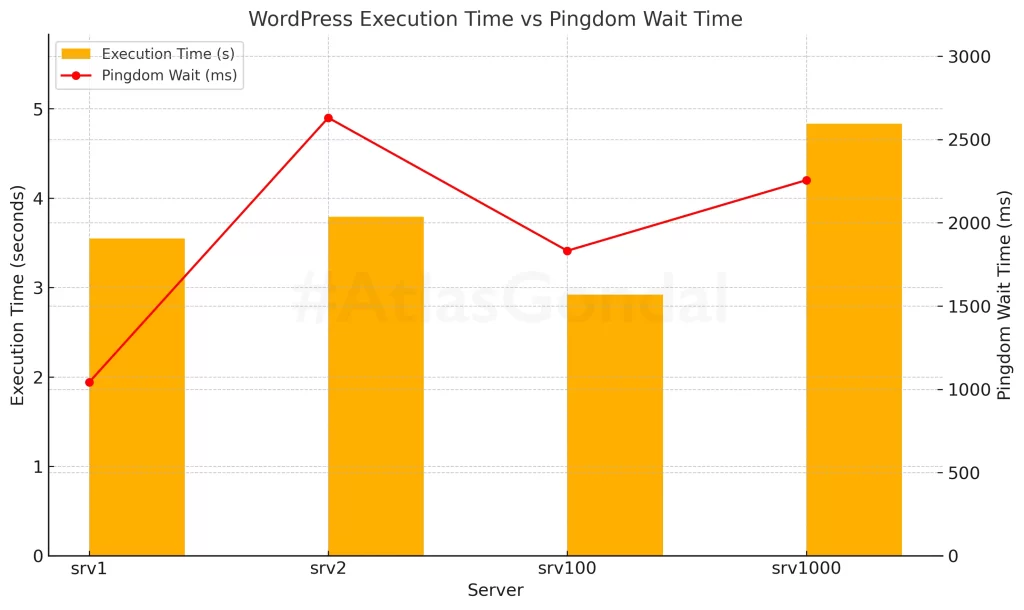
Beyond raw benchmark numbers, I also measured how the stack performs under real-world conditions — including WordPress Query Monitor metrics and first-request wait times from Pingdom (tested from San Francisco, USA).
- srv1 had the highest page load time (0.92s) despite strong backend performance. Its wait time of 831ms suggests frontend TTFB (Time to First Byte) still has room for optimization — possibly due to Redis cold starts or initial PHP process warmup.
- srv2 reported the fastest page load (0.69s) but the longest network wait time (1464ms). This mismatch is common for remote regions like Singapore where backend response is quick, but physical distance adds major latency.
- srv100 achieved the best balance overall: low total load time (0.87s), lowest backend processing time (0.02s), and a very fast 753ms wait time — making it the most “snappy” experience from the user’s perspective.
- srv1000, the Intel-based droplet, surprised with a strong frontend performance — just 745ms wait and a total load time of 0.81s. This reinforces that FPM closes the performance gap for older architecture in practical scenarios.

srv2loaded fast internally but suffered from high external wait times — highlighting how geographic latency affects international visitors.srv100offered the best balance of backend efficiency and frontend responsiveness.srv1000again proved that older hardware can keep up — with a strong showing in user-facing speed.srv1was slightly slower in perceived speed despite strong backend throughput, showing how small factors like PHP warmup and Redis cache state can impact TTFB.
Conclusion
After benchmarking the same WordPress site across four Digital Ocean droplets — first with PHP-CGI, then with PHP-FPM — the results speak for themselves.
PHP-FPM didn’t just improve performance; it transformed the way each server handled traffic, concurrency, and user experience. Even the modest 1GB droplets, like srv1, consistently outperformed their earlier selves. Median response times dropped by over 70%, requests per second nearly tripled, and none of the servers crashed — even under intense 1,000-request, 50-concurrent-user loads.
Notably, srv100, with 2GB of RAM, delivered the most balanced frontend and backend experience, while srv1000 (Intel-based) proved that smart stack choices can make older hardware surprisingly competitive. The consistent lag from srv2 reminded me that server region still plays a huge role in real-world speed — especially when targeting specific geographies.
If you’re serious about WordPress performance, switching from PHP-CGI to PHP-FPM is a no-brainer. And if you want real results, benchmark your own setup — because the spec sheet doesn’t tell the whole story.
Need Help?
I help developers and teams build fast, secure, and scalable systems — from WordPress to APIs, and from LAMP stacks to mobile apps. Whether it’s performance tuning, infrastructure, or DevOps support, I’ve got you covered.
Try DigitalOcean with $200 in free credit or get in touch to start your project.